Article Contaminated Land

The Changing Landscape of Land Contamination

- by
Tags: Featured

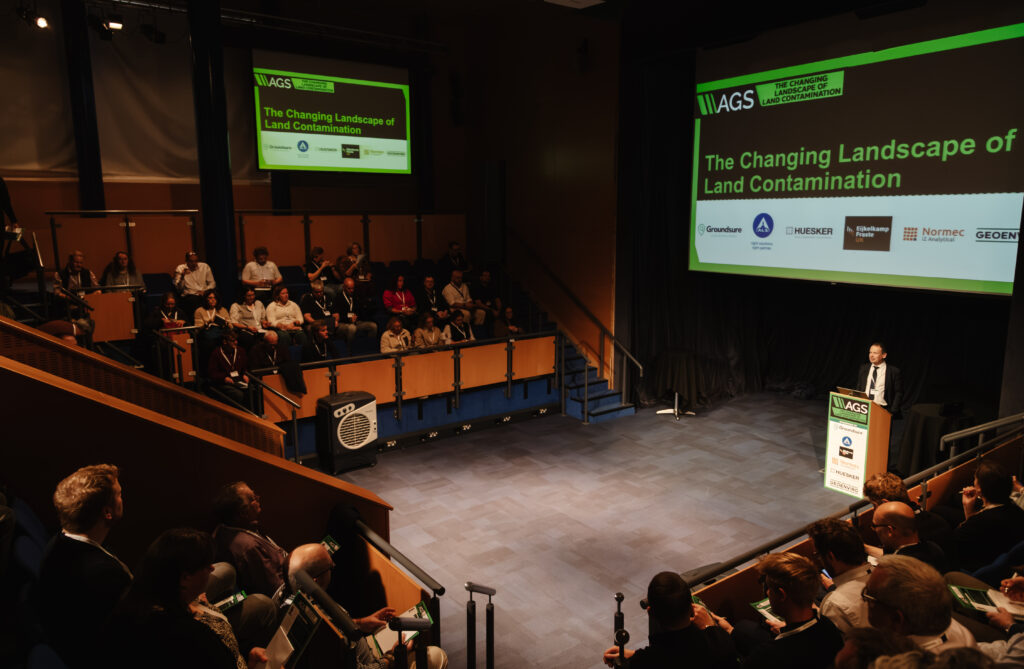
The Changing Landscape of Land Contamination conference was held on 15th October 2026 at Thinktank Birmingham Science Museum. The sellout event welcomed 170 delegates for a full-day programme examining the technical, legal and regulatory developments shaping the land contamination sector.

Across four sessions, speakers explored how updated standards, emerging contaminants, improved monitoring and changing legal expectations are influencing professional practice. The programme also included a panel discussion titled Land Contamination: Meeting Technical, Societal and Legal Expectations.

Session 1

Chaired by Geraint Williams (Associate Technical Director at HKA and AGS Chair Elect), Session 1 began with Professor Paul Nathanail (Director at Land Quality Management), who discussed BS 10175:2026 and its role in supporting a professional approach to the investigation of potentially contaminated sites. He outlined the importance of robust information throughout site characterisation, risk assessment and remediation verification, particularly in supporting the safe redevelopment of post-industrial brownfield land.

Dr Anna Willetts (Partner at Gunnercooke) and Samantha Riggs (Barrister at 25 Bedford Row) followed with a legal perspective on landfill, considering the regulatory and liability issues that influence decision-making in practice.

Session 2

Following a refreshment break, Session 2 was chaired by Stephanie Cox (Director at E3P and member of the SoBRA Executive Committee – Early Careers). Dr Rob Sweeney (Technical Director at CL:AIRE) presented an update on work to modernise 15 Department of the Environment industry profiles created more than 30 years ago. The revised profiles address contaminant groups including per- and polyfluoroalkyl substances (PFAS) and persistent organic pollutants (POPs), with information presented through an interactive matrix and supporting profile pages.

Pagen Spooner (Geo-Environmental Consultant at EPG) then explored the benefits of measuring dissolved methane when interpreting ground-gas results. Drawing on recent research, Environment Agency guidance and case studies, Pagen considered uncertainties in current field and laboratory sampling methods and explained how dissolved methane probes can provide clearer evidence for risk assessment and design decisions.

Session 3

After lunch and networking opportunities, Session 3 was chaired by Dr Rob Sweeney. Dr Paul McMahon (Associate Technical Director at RSK Geosciences), presented a case study on RSK Geosciences’ approach to developing and applying Sustainable Management Practices. He explained how the company’s digital tool helps project teams identify, track and showcase better practice while supporting more sustainable outcomes for land development and management. The presentation also highlighted the importance of integrating climate risk and resilience into geo-environmental assessments.

The session concluded with a panel discussion chaired by Professor Paul Nathanail featuring Pagen Spooner, Dr Anna Willetts, Christopher Swainston, Barry Mitcheson and Dr Paul McMahon. The panellists answered audience questions on the technical, societal and legal expectations affecting the land contamination sector.

Session 4

The final session was chaired by Claire Dickinson (Director at Geo-Environmental Matters and SiLC PTP member). Dr Cecilia MacLeod (Managing Director and Co-Founder at Anthera Remediation Technologies) opened with a presentation on developments in the remediation of PFAS in soils and waters.

The final presentation came from Steve Forster (Director at Remedia Group), who asked whether current approaches to asbestos air monitoring during remediation provide sufficient assurance for nearby homes, schools, workplaces and public spaces.

It was a highly successful event that provided valuable opportunities for professionals across the sector to share technical knowledge, discuss developing regulation and explore practical responses to emerging challenges in land contamination.

The AGS extends its thanks to all speakers and sponsors, including Groundsure, ALS, HUESKER, Eijkelkamp Fraste UK, Normec i2 Analytical and GeoEnviro Solutions.


Article Contaminated Land Laboratories

How Certain Is Your Laboratory Result? Detection Limits, Measurement Uncertainty and False Confidence in Contaminated Land Decisions

- by
Tags: Featured

Introduction

Deciding whether to remediate or to stop remediating land contamination is routinely made on the basis of laboratory results that appear precise and accurate: concentrations below an assessment criterion may be treated as acceptable and above it as unacceptable. Yet that apparent granularity can conceal important limitations.  This becomes particularly important when the criterion is very close to the lowest concentration the laboratory can detect.

A result reported as <0.01 mg/kg does not indicate the absence of a substance. Equally, a result of 10.2 mg/kg does not mean that the true concentration is known exactly to three significant figures. Every reported concentration has limitations arising from detection capability, method performance and measurement uncertainty. Before the sample reaches the laboratory, uncertainty is introduced by site heterogeneity, sampling, handling and sub-sampling – topics for another day.

An analytical result is therefore not simply a number. It is an estimate produced by a measurement process that represents a number with a specified degree of confidence. The key question for the risk assessor is not only “What result did the laboratory report?” but “What does this result actually allow me to conclude?”

What does “not detected” actually mean?

A result reported as <0.01 mg/kg does not establish that the analyte concentration is zero. Indeed no chemical analysis can report that a substance is completely absent – leaving aside the philosophical reality that “zero” is not a number.  “Not detected” means that the analyte cannot be reported quantitatively above a defined analytical threshold, which may be described as a detection limit, quantification limit or reporting limit depending on the method and laboratory. These terms are related, but are not interchangeable.

Laboratory analysis depends on the equipment responding to the presence of a substance – the higher the concentration of that substance the stronger the response.  At low concentrations, an analytical response becomes progressively more difficult to distinguish from variation caused by instrument noise, blanks, extraction, matrix interference and other components of the measurement process (Analytical Methods Committee, 1987; Cantwell, 2025). The limit of detection (LOD) is therefore better understood as a measure of detection capability under defined analytical conditions rather than simply “the lowest concentration the instrument can resolve”.

Instrumental sensitivity is only one part of a method. Performance must also reflect extraction, clean-up, identification, quantification and reflects the effects of the environmental matrix.

The Environment Agency’s Monitoring Certification Scheme (MCERTS ) provides a recognised framework for demonstrating that environmental monitoring equipment, personnel and laboratory activities meet defined quality and performance standards.  It requires laboratories to demonstrate a method’s suitability for the analyte(s), relevant matrix and intended application (Environment Agency, 2021, 2023).

Detection or (reliable) quantification

The limit of quantification (LOQ) represents the lower concentration at which a result can be quantified with acceptable performance for its intended purpose. Below the LOD, the method cannot reliably distinguish the presence of an analyte from analytical background. Between the LOD and LOQ, there may be evidence that the analyte is present, but quantitative confidence is reduced. Above the LOQ, the concentration of the analyte can be quantified within the established performance of the method (Analytical Methods Committee, 1987; Cantwell, 2025).

Environmental laboratory certificates of analysis may use a further term: the reporting limit. This may equal or be higher than the LOQ. A laboratory may use a reporting limit above instrumental detection capability because it reflects the concentration at which the complete method can routinely provide reliable results. For example, an LOD of 0.001 mg/kg, an LOQ of 0.003 mg/kg and a routine reporting limit of 0.01 mg/kg are perfectly compatible.

A problem arises when <0.01 mg/kg is treated as zero. The true concentration could be 0.002, 0.005 or 0.009 mg/kg. The laboratory has not resolved the concentration below that threshold. Treating low-level observations as though nothing has been measured can also distort subsequent interpretation (Analytical Methods Committee, 2001, 2020).
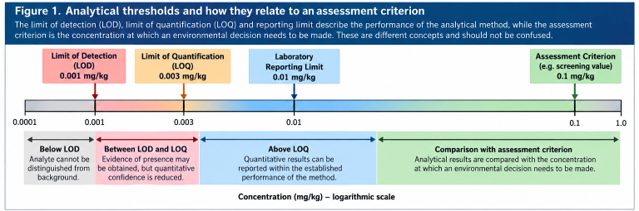
Figure 1. Analytical thresholds and how they relate to an assessment criterion.

The assessment criterion must be considered before analysis

Suppose the relevant soil assessment criterion is 0.005 mg/kg but the selected laboratory method has a reporting limit of 0.01 mg/kg. A result of <0.01 mg/kg cannot demonstrate compliance with the 0.005 mg/kg criterion because the actual concentration could still exceed the criterion: the method has failed to demonstrate that the concentration is below the criterion.

The analytical method should therefore be selected in relation to the concentration at which the environmental decision must be made. The useful question is not simply “Can the laboratory analyse PFOA or benzene?” It is “Can the laboratory measure this substance reliably at a concentration sufficiently low to support the decision I need to make?” Ideally, that question is answered before samples are collected (Environment Agency, 2021, 2023).  Some risk assessors prefer a reporting limit no more than 10% of the assessment criterion – albeit this is not always possible for all analytes in all media.

A detected concentration is still not exact

Once a numerical concentration is reported, measurement uncertainty becomes important. A result such as 11.3 mg/kg should not be interpreted as though the true concentration is exactly 11.3 mg/kg. Uncertainty can arise from homogenisation and sub-sampling, weighing, extraction and recovery, calibration, reference materials, instrument repeatability, matrix effects, blank correction, analyst variation and data processing (JCGM, 2008; Ellison and Williams, 2012).

Sources of Uncertainty in Laboratory Analysis
Homogenisation The process of mixing a sample until its contents are uniform; evenly distributed;the same throughout
Sub-sampling The process of taking a small amount of material out of the sample container to use for analysis
Weighing The mass of the material to be analysed, including whether it has been naturally or artificially desiccated
Extraction Using a solvent or heat to remove the analyte from the rest of the matrix


Recovery How much of a substance is extracted from the matrix
Calibration Checking the accuracy of an instrument against a known benchmark
Reference materials Materials similar to the matrix or extract being analysed whose contents are known
Instrument repeatability Producing closely matching results when measuring the same substance multiple times under identical conditions.
Matrix effects The influence of other components in the sample on the measured response of the target analyte
Blank correction Allowing for the measured concentrations in what should be a sample known to contain none of the substance
Analyst variation The effects of different people carrying out the analysis
Data processing The conversion of equipment generated data into the values reported in the certificates of analysis

Table 1  Some sources of uncertainty in laboratory analysis

Relative uncertainty often becomes more important toward the lower end of a method because blanks, background variation, recovery and instrumental noise become larger in relation to the amount of analyte present. Detection capability asks whether the analyte can be distinguished from background; measurement uncertainty asks how much confidence can be placed in the quantitative result. They are different concepts, but they increasingly interact at low concentrations.

What happens close to an assessment criterion?

Measurement uncertainty is not a mathematical adjustment factor to be applied according to the preferred outcome. Where a formal statement of conformity is required, the way uncertainty is incorporated should be defined by an appropriate decision rule (ISO/IEC, 2017; ILAC, 2019).

Consider an assessment criterion of 10 mg/kg and results of 9.5 ±2.0 mg/kg and 10.5 ±2.0 mg/kg. The measured values fall either side of the criterion, but both uncertainty intervals overlap it. It is not scientifically defensible simply to subtract uncertainty from the higher result and call it a pass, or add uncertainty to the lower result and call it a failure.  It is also not defensible to treat the assessment criterion as either an integer or as an “exact” number.
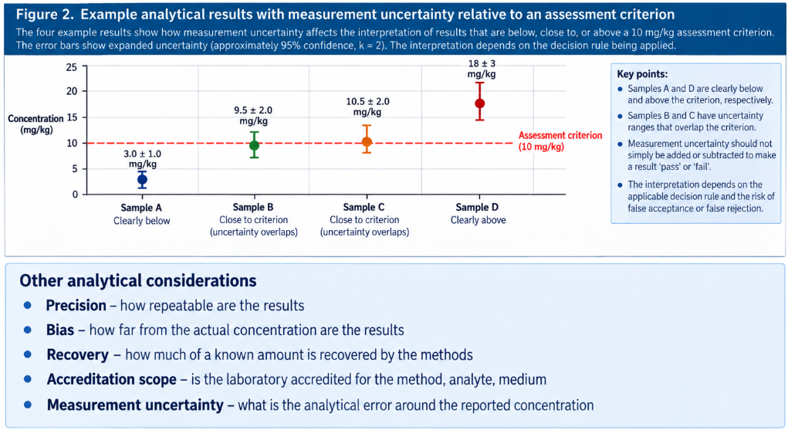
Figure 2. Example analytical results with measurement uncertainty relative to a 10 mg/kg assessment criterion.

Decision rules and guard bands

Conformity, or compliance, means that a measured result meets the specified requirement or acceptance criterion when the applicable decision rule and measurement uncertainty are taken into account. In this case it means the concentration being below the assessment criterion.

ISO/IEC 17025 defines a decision rule as how measurement uncertainty is accounted for when stating conformity. Where a laboratory reports “complies”, “does not comply” or “pass/fail”, it must document the rule and consider decision risk unless the rule is inherent in the specification (ISO/IEC, 2017; ILAC, 2019).

In contaminated-land work, the laboratory often reports the concentration while the consultant interprets it within a risk-assessment framework. The laboratory conformity decision and the environmental risk decision are therefore not the same thing. However, the underlying question remains: how will uncertainty be treated when the measured concentration is close to the decision threshold?

A guard band moves the acceptance boundary away from the specification limit so uncertainty is considered. It can reduce false acceptance but increase false rejection. No rule is universally correct; the approach depends on legislation, regulatory guidance, decision consequences and assessment purpose (ILAC, 2019; JCGM, 2012).  It also needs to reflect the nature of the assessment criterion. Most generic assessment criteria including the Suitable for Use Levels (Nathanail et al 2015) are concentrations which if not exceeded represent minimal or no appreciable risk to human health. Some are based on such over cautious dose-response relationships that concentrations exceeding them require careful consideration.

Why can reporting limits vary between samples?

Different reporting limits within one laboratory report do not necessarily indicate inconsistency. Environmental samples can be analytically difficult. High concentrations of petroleum hydrocarbons or other matrix components may require dilution or additional clean-up to separate them from other confounding substances. A ten-fold dilution to ensure the analytical equipment can safely receive the sample can result in a ten-fold increase in the effective reporting limit. Other causes include limited sample mass, high moisture content, matrix suppression or enhancement, co-eluting compounds, poor recovery or elevated blank contamination.

Practitioners should therefore look beyond the concentration column. Qualifiers, dilution factors, accreditation status, dry-weight corrections, laboratory comments and reporting limits may materially affect interpretation (Environment Agency, 2023).

“Non-detect” is not a synonym for “zero”

Results below reporting limits are censored (cut-off) data, not measured zeros. Replacing <0.1 µg/L with zero, with 0.1 µg/L, or with half the reporting limit for further statistical calculations creates three different artificial datasets. The appropriate treatment depends on the purpose of the assessment, the proportion of censored data and the statistical method used (Analytical Methods Committee, 2001, 2020). This may be unimportant for simple screening, but it can materially affect trend analysis, contaminant-load calculations, background estimates and statistical comparisons.

Laboratory uncertainty is not the whole uncertainty

A laboratory may report 50 ±5 mg/kg with excellent precision, but that does not establish that 50 mg/kg represents a heterogeneous site. Laboratory uncertainty normally concerns the defined procedure and test portion under laboratory control; it does not automatically include borehole location, sample number or depth, soil heterogeneity, field sampling, storage, transport or representativeness (Environment Agency, 2021).

In contaminated land, sampling uncertainty, sub-sampling uncertainty and analytical uncertainty are distinct but related. In a heterogeneous site, sampling uncertainty may be much larger than laboratory uncertainty. There is little value debating whether analytical uncertainty is 8% rather than 10% if the sampling programme cannot establish natural variation in the material being assessed.

Precision is not the same as accuracy: repeated results can agree closely yet all be biased – deviate from the correct or accurate value. Method validation therefore considers precision, bias and recovery rather than repeatability alone (Cantwell, 2025; Environment Agency, 2023). Similarly, reporting extra decimal places does not create extra confidence; 12.347 ±2.1 mg/kg does not support interpretation to three decimal places.

When the method cannot reach the decision concentration

If an assessment criterion is 0.001 µg/L but the best achievable reporting limit is 0.005 µg/L, a result of <0.005 µg/L cannot demonstrate compliance. The correct conclusion is that the method cannot determine whether the concentration is above or below the criterion. Options may include a more sensitive method, a different laboratory, additional clean-up, reduced dilution, increased sample mass or volume where appropriate, confirmatory analysis, alternative lines of evidence or explicit acknowledgement of the limitation in the risk assessment.

This issue is increasingly relevant for PFAS, pharmaceuticals, pesticides and other emerging contaminants, where assessment criteria can be exceptionally low. A larger analytical suite is not automatically better than a smaller one; the essential question is whether the method is fit for the environmental decision being made (Cantwell, 2025).

A better way to design contaminated-land analysis

Rather than beginning with a laboratory’s standard analytical package, begin with the decision:

  1. Identify the contaminant of concern.
  2. Identify the relevant assessment criterion.
  3. Confirm that the laboratory can achieve an appropriate reporting limit relative to that criterion.
  4. Understand method performance, including precision, bias, recovery, accreditation scope and measurement uncertainty.
  5. Consider whether matrix effects or dilution could increase reporting limits.
  6. Decide in advance how borderline results will be interpreted and whether a decision rule is required.
  7. Confirm that the sampling strategy can produce material representative of the population or area being assessed.

Practitioners should also ask whether the method is accredited for the relevant matrix and analyte; whether results are dry-weight or as-received; how results between detection and quantification limits are handled; how dilution affects reporting limits; and whether reported uncertainty includes sampling. Usually it will not unless sampling has been included in the measurement procedure and uncertainty evaluation.

The key concept: uncertainty is information

Measurement uncertainty is sometimes viewed as weakening a result. In reality, it describes the result more fully. It helps the practitioner judge whether apparent differences between samples are significant, whether trends exceed analytical variability, how confidently a result can be compared with a decision threshold and whether confirmation may be justified. Detection and reporting limits provide the same type of information: they define what the analytical method can and cannot establish.

Conclusion

Analytical chemistry does not produce perfect numbers. It produces measurement results with limitations. Four questions should accompany every important contaminated-land result:

Food for thought – Questions to ask of an analytical result
What could the laboratory detect?
At what concentration can it quantify reliably?
What uncertainty is associated with the reported value?
Is the overall sampling and measurement process capable of supporting the environmental decision?

Table 2 Food for thought: key questions for interpreting an analytical result

A result of <0.01 mg/kg does not mean zero. A result of 10.2 mg/kg does not mean the concentration is known exactly to 0.1 mg/kg. An uncertainty of ±2 mg/kg cannot simply be added or subtracted according to which conclusion is preferred.

As assessment criteria become lower and analytical decisions become more demanding, particularly for emerging contaminants, understanding detection limits, reporting limits and measurement uncertainty will become more important, not less. The most useful question when reviewing a laboratory certificate may therefore be not “What number did the laboratory report?” but “How certain am I that this analytical result is capable of supporting the decision I am about to make?”

References

Analytical Methods Committee (1987) ‘Recommendations for the definition, estimation and use of the detection limit’, Analyst, 112, pp. 199–204. doi:10.1039/AN9871200199.

Analytical Methods Committee (2001) ‘Measurement of near zero concentration: recording and reporting results that fall close to or below the detection limit’, Analyst, 126(2), pp. 256–259. doi:10.1039/B009590G.

Analytical Methods Committee (2020) ‘The edge of reason: reporting and inference near the detection limit’, Analytical Methods, 12, pp. 401–403. doi:10.1039/C9AY90188D.

Cantwell, H. (ed.) (2025) The Fitness for Purpose of Analytical Methods: A Laboratory Guide to Method Validation and Related Topics. 3rd edn. Eurachem.

Ellison, S.L.R. and Williams, A. (eds.) (2012) Eurachem/CITAC Guide: Quantifying Uncertainty in Analytical Measurement. 3rd edn. Eurachem. ISBN 978-0-948926-30-3.

Environment Agency (2021) Using MCERTS for the Chemical Testing of Soil. Bristol: Environment Agency.

Environment Agency (2023) MCERTS: Performance Standard for Laboratories Undertaking Chemical Testing of Soil. LIT 6625. Bristol: Environment Agency.

ILAC (2019) ILAC-G8:09/2019: Guidelines on Decision Rules and Statements of Conformity. International Laboratory Accreditation Cooperation.

ISO/IEC (2017) ISO/IEC 17025:2017: General Requirements for the Competence of Testing and Calibration Laboratories. Geneva: International Organization for Standardization.

JCGM (2008) Evaluation of Measurement Data – Guide to the Expression of Uncertainty in Measurement. JCGM 100:2008. Joint Committee for Guides in Metrology.

JCGM (2012) Evaluation of Measurement Data – The Role of Measurement Uncertainty in Conformity Assessment. JCGM 106:2012. Joint Committee for Guides in Metrology.

Nathanail, C.P., McCaffrey, C., Gillett, A.G., Ogden, R.C. and Nathanail, J.F. (2015) The LQM/CIEH S4ULs for Human Health Risk Assessment. Nottingham: Land Quality Press. ISBN 978-0-9931084-0-2.

Thompson, M. and Ellison, S.L.R. (2013) ‘Towards an uncertainty paradigm of detection capability’, Analytical Methods, 5, pp. 5857–5861. doi:10.1039/C3AY41209A.

Article provided by Ken Scally¹˒² Paul Nathanail3

¹ Calibre Scientific, Shannon Free Zone, Co. Clare, Ireland

² Department of Earth and Environmental Sciences, Mount Royal University, Calgary, Alberta, Canada

3 Land Quality Management, UK

 

Article Digital Transformation of Ground Data

Digital Transformation of Ground Data Becomes an AGS Working Group

- by
Tags: Featured

Ground engineering is becoming increasingly digital. Data are generated, collected, exchanged and analysed in greater volumes than ever before. However, much of their potential value remains unrealised, with information often fragmented across projects, organisations, digital platforms and incompatible formats.

Recognising the opportunity to improve how ground information is generated, managed, shared and applied, the Association of Geotechnical and Geoenvironmental Specialists  has established Digital Transformation of Ground Data (DTGD) as a new Working Group.

Originally launched in 2025 as an independent volunteer-led initiative, DTGD now formally brings together representatives from industry, academia, software providers and client organisations under the AGS umbrella.

The Working Group aims to become the collective voice for the digital transformation of ground engineering, providing a forum to share knowledge, coordinate industry input, develop best practice and improve the way ground data are created, managed, exchanged and used. Its ultimate goal is to deliver better outcomes for infrastructure, society and the environment.

Key Objectives

Improving Access to and Reuse of Ground Data

Ground data is often collected at significant cost, yet many valuable datasets remain inaccessible or underutilised once projects are completed. The Working Group will promote practical approaches to improve the discoverability, accessibility and responsible reuse of ground information across the industry.

This includes supporting initiatives that help organisations identify where historical and emerging datasets exist, encouraging the sharing of legacy ground investigation information, and exploring opportunities to improve access through national repositories and other digital platforms. Improving access to existing information can reduce duplication, support better-informed decisions and unlock value from data that have already been collected.

Creating a Digital Golden Thread Across the Asset Lifecycle

The value of ground data increases when information remains connected throughout its lifecycle. Data generated during planning and investigation should continue to inform interpretation, design, construction, operation and future development.

The Working Group promotes the concept of a digital “golden thread” of information, providing traceability and continuity across project stages that have traditionally been disconnected. Better integration of information can improve understanding, reduce risk and enable asset owners to derive greater long-term value from their data.

Achieving this vision will require collaboration between industry stakeholders, software vendors and asset owners to improve interoperability and support seamless data exchange.

Improving Data Management and Interoperability

Consistent standards and effective information management are fundamental to digital transformation. The Working Group will support initiatives that improve how ground data is specified, managed, exchanged and validated, including the wider adoption of recognised standards such as AGS’s data format and the implementation of digital workflows.

Greater interoperability between organisations and software platforms will enable more efficient data exchange throughout the project lifecycle, reducing information loss and rework. The focus is on improving the quality, consistency and usability of data to achieve better project outcomes and maximise return on investment.

Building the Future Geo-Digital Workforce

Technology alone will not deliver digital transformation. Success depends on people having the skills, confidence and ambition to implement and sustain change, and on the wider industry embracing new ways of working.

A key objective of the Working Group is to help develop the future geo-digital workforce by strengthening capabilities in the management, analysis, interpretation and sharing of ground data. This includes addressing skills gaps, supporting professional development and creating clear learning pathways to improve digital maturity across the sector.

By investing in people alongside technology, organisations can strengthen capability, encourage innovation and realise the full benefits of digital transformation.

Influencing Policy, Data Stewardship and Ownership

Many of the challenges associated with digital ground data extend beyond technology. Issues such as ownership, stewardship, confidentiality, commercial sensitivity, liability and long-term governance must also be addressed.

The Working Group provides a forum to discuss these topics, share diverse industry perspectives and help shape future policy, guidance and best practice. By promoting responsible data stewardship and greater clarity around ownership and governance, the Group aims to support a more trusted, connected and sustainable future for ground engineering.

The Group will also engage with government bodies, infrastructure owners and other stakeholders to encourage alignment of objectives and collaboration across the wider sector.

Get Involved

The Working Group welcomes active contributors from across the ground engineering community who are interested in helping shape the future of digital ground engineering.

To find out more or get involved, visit the AGS website.

Leadership:

Chair: Vicky Corcoran

Deputy Chair(s): Andrea Gillarduzzi & TBC

Web

https://www.ags.org.uk/group/digital-transformation-of-ground-data/

Article contributed by

Andrea Gillarduzzi (Arcadis) and Alison Greenall (AtkinsRéalis)

Article Safety

Geotechnical & Geoenvironmental Industry Accident Statistics 2025

- by
Tags: Featured

The increased level of data sharing for the 2025 reporting year has provided a more comprehensive and representative picture of safety performance across the geotechnical and geoenvironmental sectors. Greater participation and a more diverse dataset have strengthened the value of what we have received, enabling more meaningful trend analysis and industry-wide learning. This continued commitment to transparency supports informed decision-making, helps identify emerging risks and areas for improvement, and encourages greater collaboration between organisations. As reporting levels continue to grow, the industry is better positioned to move beyond compliance and foster a proactive, learning-focused safety culture where collective responsibility and workforce wellbeing remain at the heart of operational excellence.

2025 AGS Industry Accident Data

The health, safety and operational performance data submitted for the 2025 reporting period captures detailed information on RIDDOR-reportable incidents, non-RIDDOR injuries, near misses, vehicle-related incidents and mental health-related absences. The data also breaks down incidents by accident type, injury severity and body part affected, enabling comparisons between organisations of different sizes and operational profiles. This information forms the basis for identifying industry trends, benchmarking performance, understanding key sources of risk and supporting targeted initiatives aimed at improving health, safety and wellbeing across the geotechnical and geoenvironmental sector.

AGS Accident Incident Rate (AIR) and Accident Frequency Rate (AFR) Summary

Accident Incident Rate (AIR) and Accident Frequency Rate (AFR) are key health and safety performance indicators used to measure and compare safety performance across organisations of different sizes. AIR measures the number of RIDDOR-reportable injuries relative to workforce size, while AFR measures the frequency of accidents in relation to the total hours worked.

To ensure consistency with previous years and maintain alignment with established industry reporting practices, the same following two accident and incident rate metrics have been applied when calculating the 2025 figures:

Accident Incident Rate (AIR) – (number of RIDDOR reportable accidents / average workforce headcount) x 100,000.

Accident Frequency Rate (AFR) – (total number of harm accidents / total number of hours worked) x 1,000,000.

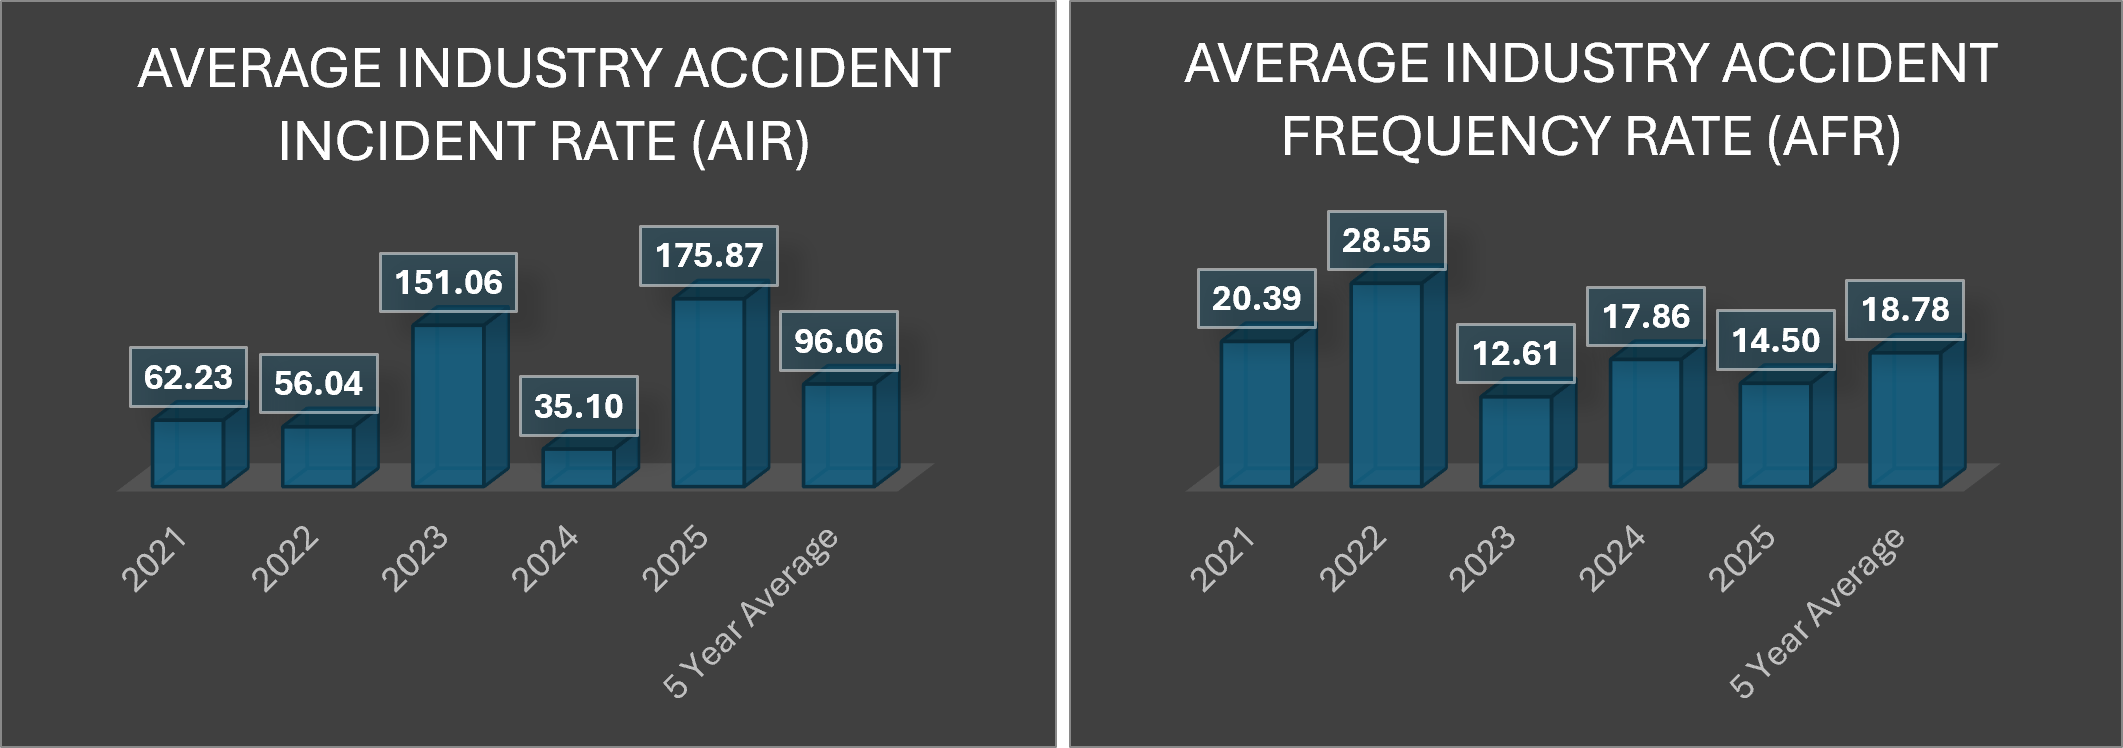
The graphs below show that the average AIR and AFR have fluctuated over the 5-year reporting period, indicating varying levels of safety performance across the industry. AIR peaked in 2025 at 175.87, suggesting a higher rate of RIDDOR-reportable injuries relative to workforce size, while AFR reached a peak in 2022 at 28.55, reflecting an increase in accidents relative to hours worked. Despite these annual variations, the 5-year average AIR of 96.06 and AFR of 18.78 provide a longer-term measure of industry safety performance, helping to identify overall trends and place annual results into a broader context.

The following section examines how the AIR and AFR vary according to contractor size over the past 5-year reporting period. By comparing performance across different workforce bands, it is possible to identify trends, highlight areas of elevated risk, and better understand the factors influencing safety outcomes across the industry. The analysis provides valuable insight into how organisational scale may affect accident and incident reporting, while helping to inform targeted improvement initiatives and future safety strategies.

AGS AIR Summary

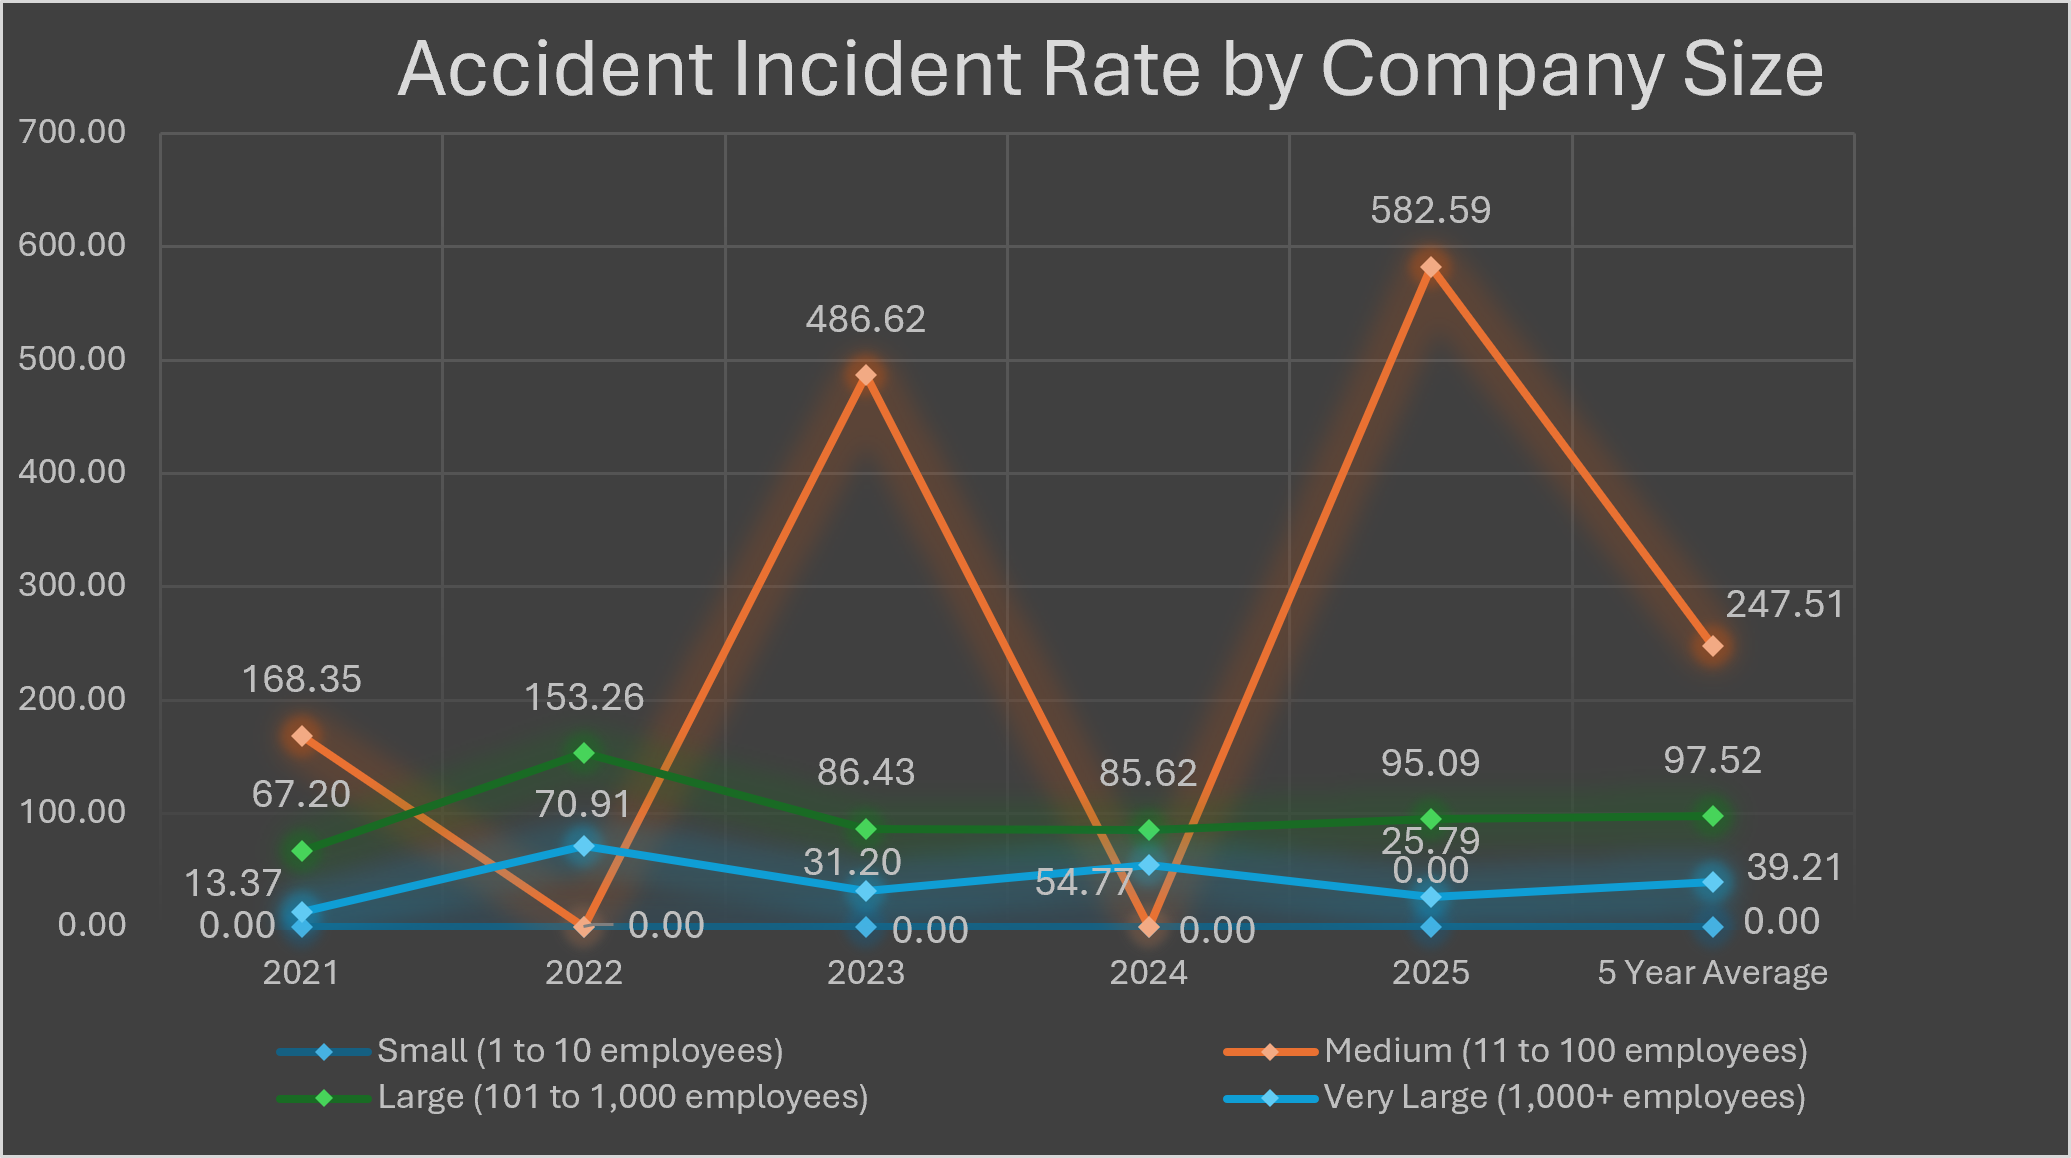
The Accident Incident Rate (AIR) highlights a clear relationship between contractor size and reported incident rates. No incidents were reported by small contractors (1–10 employees) during the reporting period, however, the relatively limited sample size within this group means the results should be interpreted with caution. As a result, the absence of reported incidents is not necessarily indicative of superior safety performance and may not provide a reliable basis for wider industry comparisons.

Medium-sized contractors (11-100 employees) recorded the highest rates by a considerable margin. Their 5-year average of 247.51 is more than 2.5x the overall industry average of 96.06, driven by exceptionally high values in 2023 (486.62) and 2025 (582.59). However, the zero values recorded in 2022 and 2024 have reduced the overall average, and it should be recognised that, until a larger and more complete dataset is available, the calculated average may not fully reflect the true level of industry performance.

In contrast, large contractors (101-1,000 employees) displayed the most consistent performance across the 5-year period. Their rates ranged from 67.20 to 153.26, resulting in a 5-year average of 97.52, almost identical to the overall industry average of 96.06. This consistency suggests that larger organisations may benefit from more mature health and safety management systems and a broader employee base that stabilises annual reporting rates.

Very large contractors (1,000+ employees) recorded the lowest overall rates, with a 5-year average of 39.21, less than half the industry average. Although some year-to-year variation was evident, particularly in 2022 (70.91) and 2024 (54.77), their reported rates remained comparatively low throughout the period. Similarly to the large contractor size outcome mentioned above, this trend may reflect the influence of well-established safety cultures, dedicated H&S resources, and greater investment in risk management processes.

AGS AFR Summary

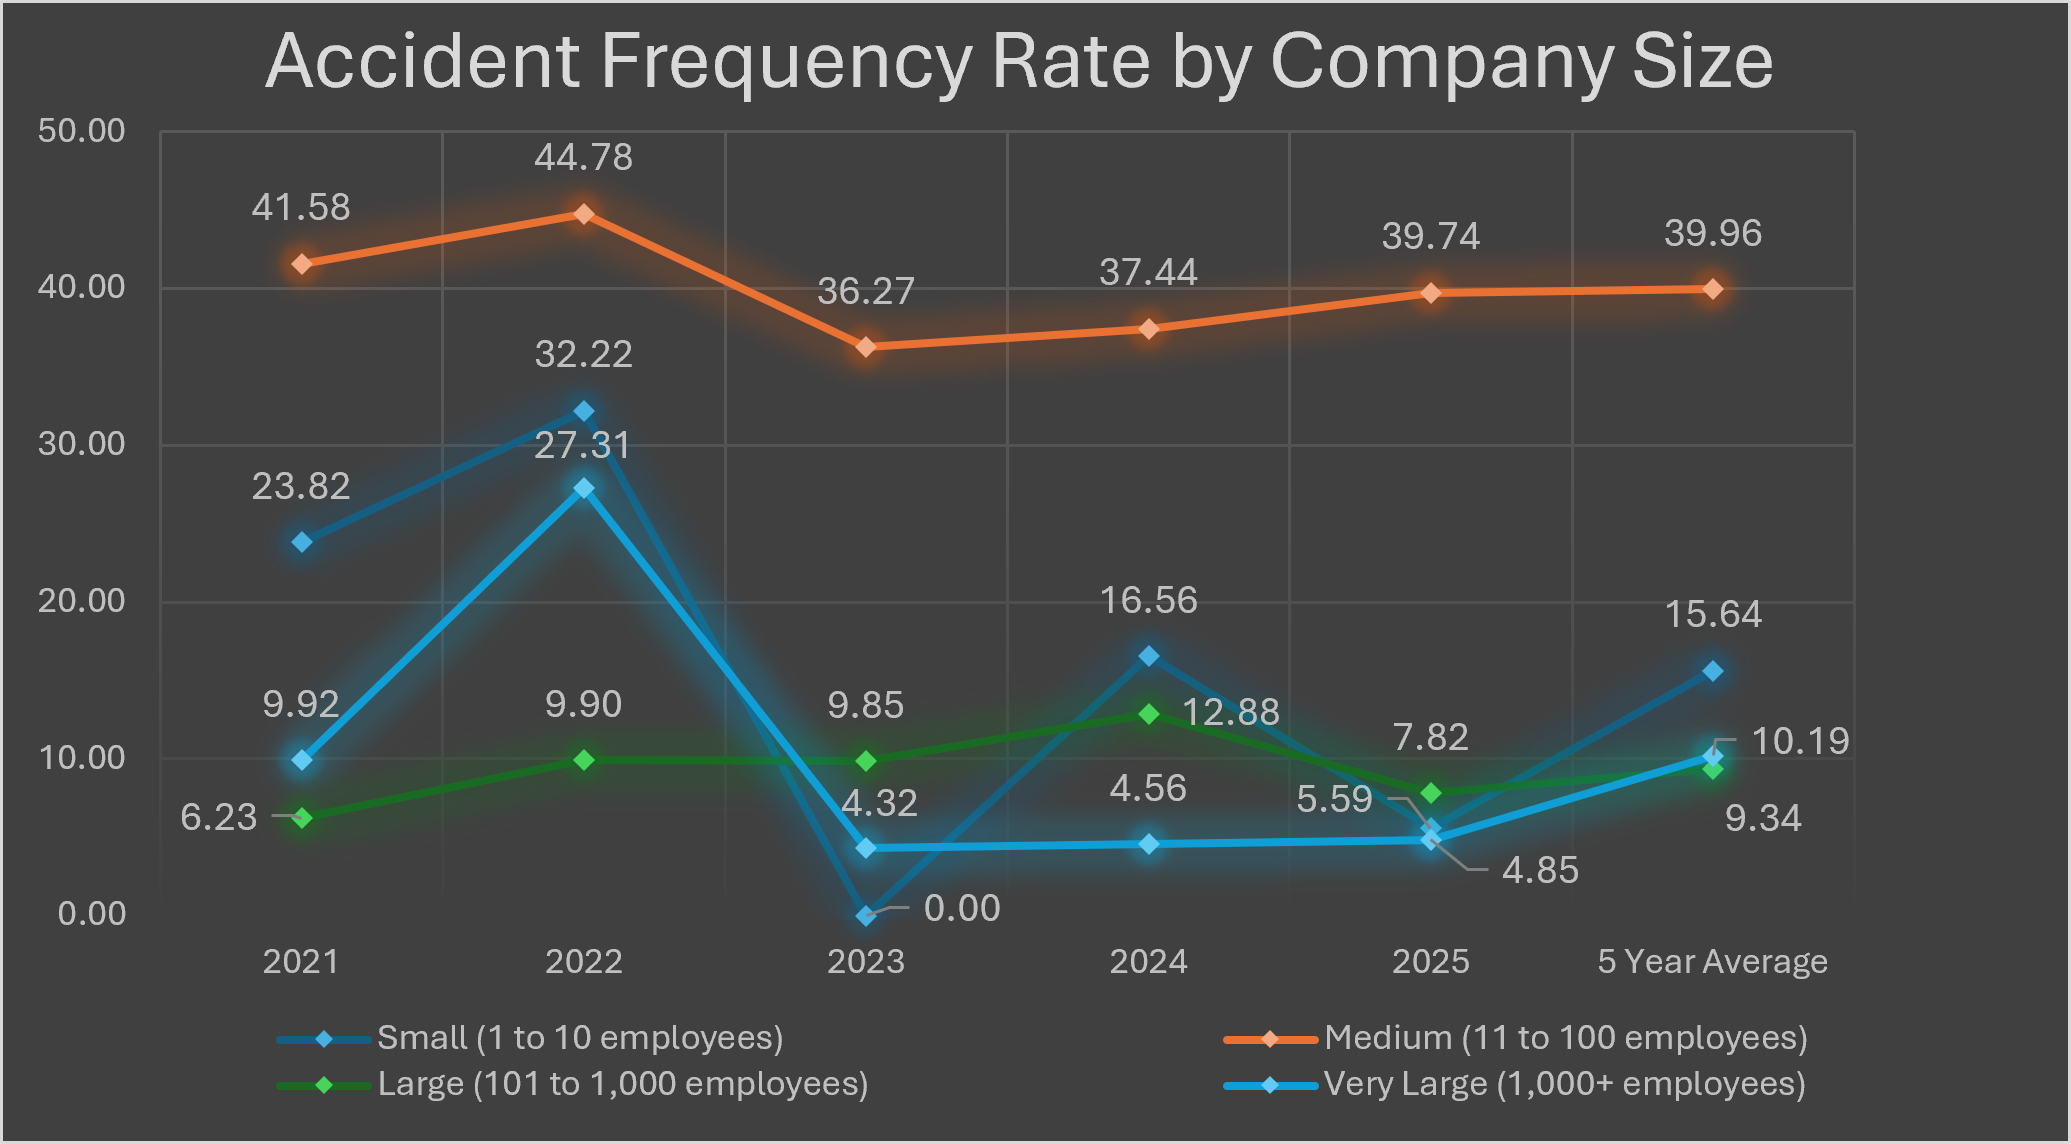
Analysis of the Accident Frequency Rate (AFR) data shows a clear trend of higher accident rates among medium-sized contractors, whilst the  other organisational groups report lower rates. The overall industry 5-year average AFR was 18.78.

Medium-sized contractors (11-100 employees) recorded the highest accident frequency rates throughout the reporting period, with a 5-year average of 39.96, more than double the industry average. Rates remained consistently high, ranging from 36.27 to 44.78, suggesting that this contractor group faces persistent challenges in managing workplace safety. Unlike other groups, there were no significant reductions or exceptional years, indicating a sustained pattern of elevated risk.

Small contractors (1-10 employees) recorded the second-highest 5-year average AFR at 15.64, although annual performance fluctuated considerably. The variability in rates across the years is likely influenced by the small workforce size, where a single accident can have a significant affect on the overall rate. Despite these fluctuations, the 5-year average remained below the industry benchmark.

Large contractors (101-1,000 employees) demonstrated consistently strong safety performance, recording a 5-year average AFR of 9.34, around half the industry average. Annual rates remained stable between 6.23 and 12.88, indicating effective safety management systems and a well-established approach to risk control.

Similarly, very large contractors (1,000+ employees) achieved a low 5-year average AFR of 10.19. While 2022 saw a temporary increase to 27.31, accident rates fell sharply in subsequent years, with values of 4.32, 4.56 and 4.85 recorded between 2023 and 2025. These figures represent some of the lowest accident frequency rates across all contractor groups and again highlight the benefits of mature health and safety systems, dedicated resources, and strong organisational safety cultures.

Overall, the data suggests that accident frequency rates generally decrease as contractor size increases, with the exception of medium-sized contractors who continue to experience the highest levels of workplace accidents, whereas large and very large organisations consistently outperform the industry average. The findings from both the AIR and AFR analysis highlight the value of robust health and safety management systems and suggest that medium-sized organisations, particularly those experiencing growth, may benefit from additional resources, support and targeted interventions to maintain strong safety performance and reduce accident rates.

Injury Trends and Key Findings

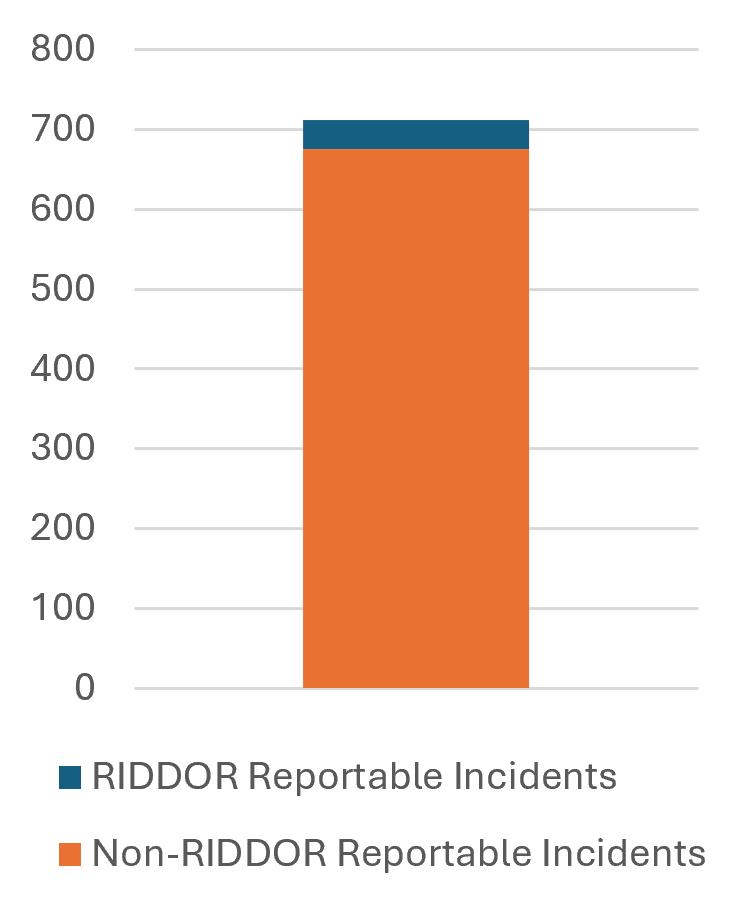
Across the survey, RIDDOR-reportable incidents were reported much less frequently than minor injuries, indicating that the majority of injuries continue to arise from routine workplace activities, everyday behaviours and low-level hazards rather than major safety failures. Whilst this reflects a relatively low incidence of serious injuries across the industry, it also demonstrates the importance of identifying and addressing lower-level hazards and recurring workplace risks. Proactive management of these issues can help prevent escalation into more serious events, reducing the likelihood of future RIDDOR-reportable incidents and supporting continued improvements in overall safety performance.

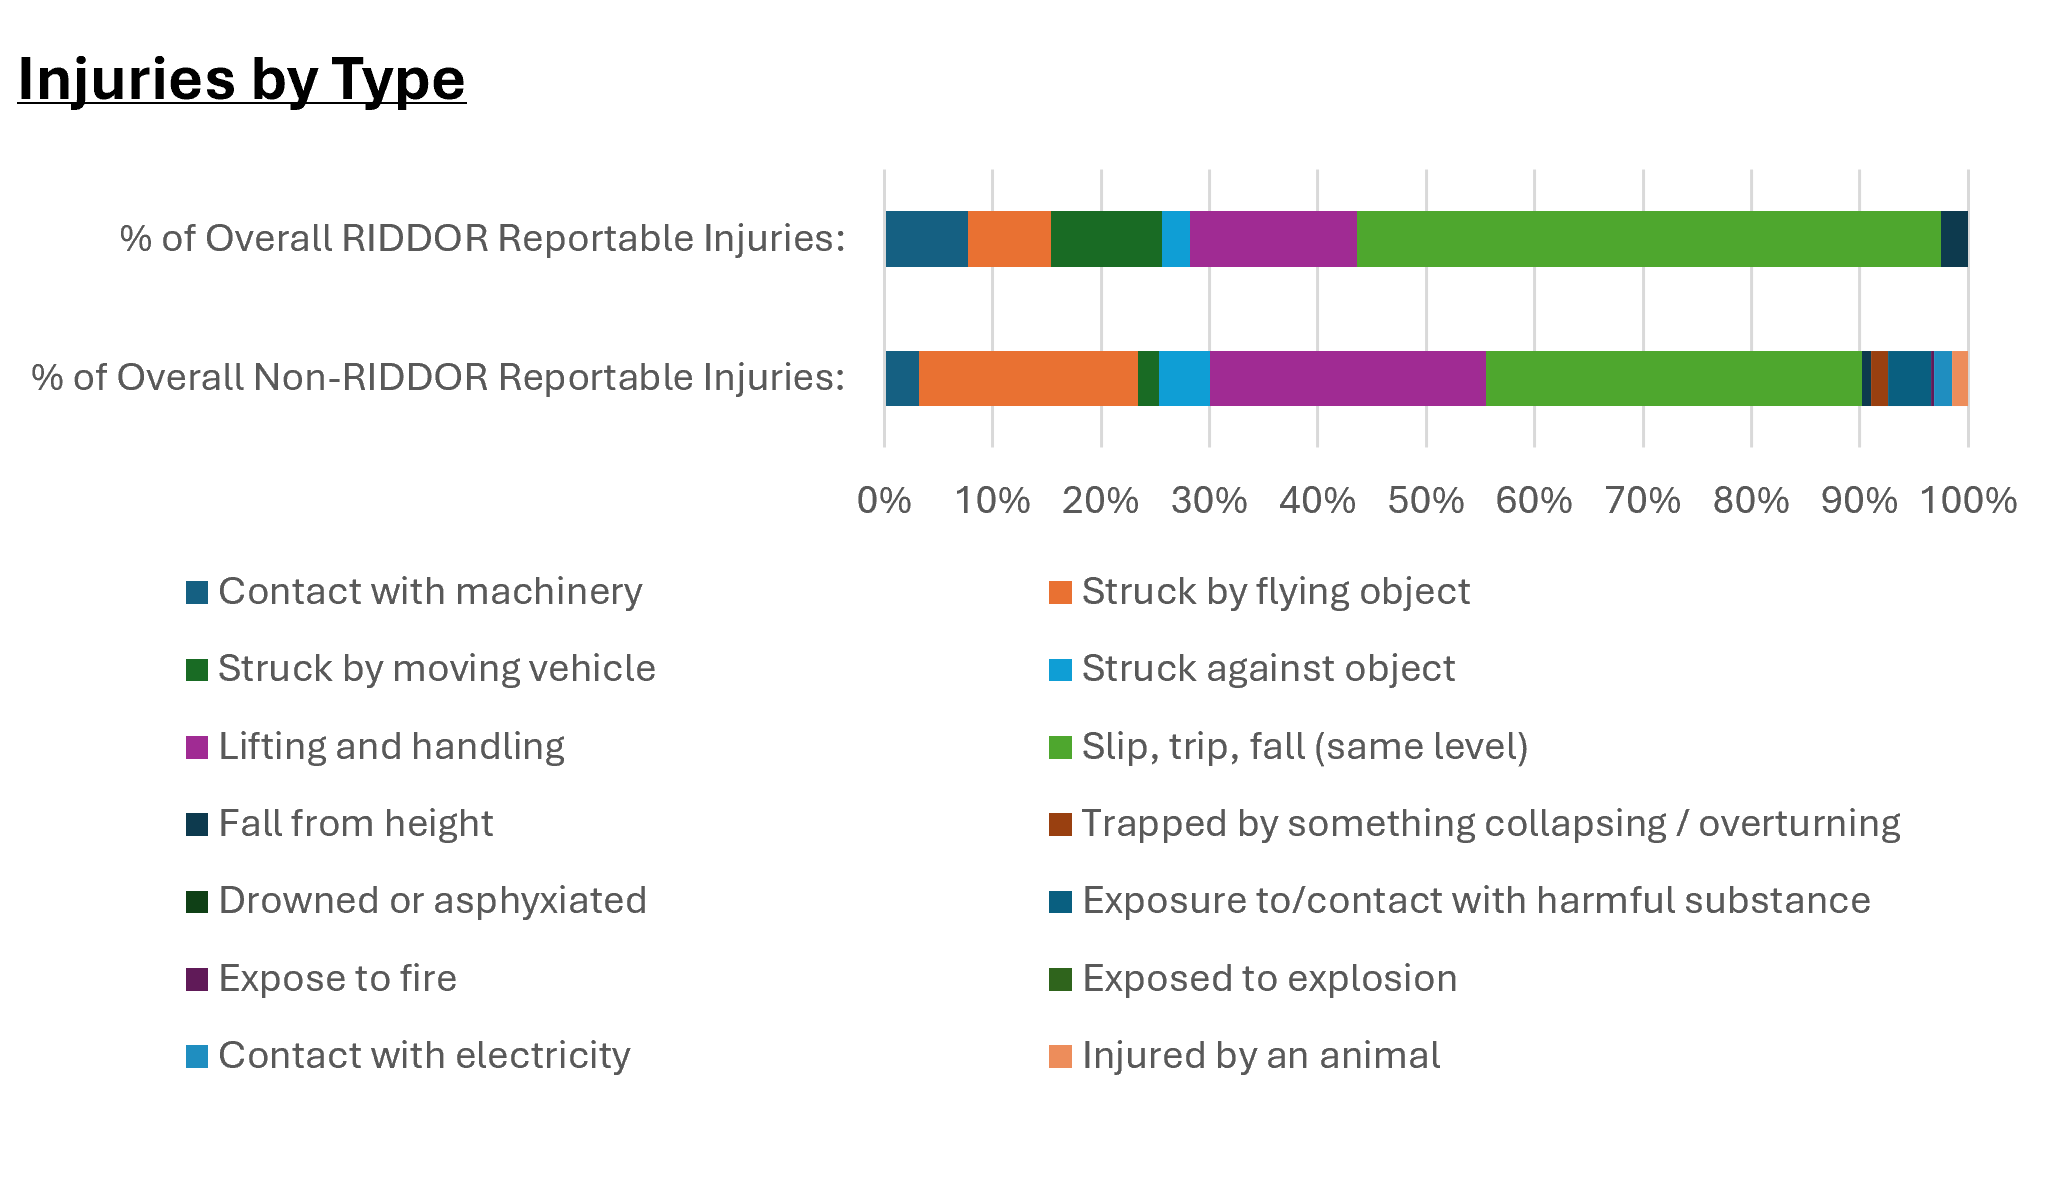
Analysis of the RIDDOR-reportable data shows that serious injuries are largely driven by the same activities responsible for the highest number of minor injuries. Slips, trips and falls on the same level accounted for more than half of all RIDDOR-reportable incidents, while lifting and handling activities contributed a further 15%. Together, these categories represented almost 70% of all serious injuries reported. This suggests that the industry’s most significant injuries are not typically the result of rare or catastrophic events but instead arise from routine activities carried out daily across a wide range of projects and workplaces. This reinforces the importance of learning from lower-level incidents and near misses, as addressing their underlying causes can help prevent more serious accidents and reduce the likelihood of future RIDDOR-reportable events.

A similar pattern was observed within the non-RIDDOR reportable data. Slips, trips and falls on the same level accounted for more than one-third of all reported injuries, with lifting and handling incidents contributing a further quarter. Injuries caused by flying objects also featured prominently, representing over 20% of all cases. Collectively, these three categories accounted for more than 80% of all non-RIDDOR injuries reported.

Traditionally high-consequence incident types, such as falls from height, vehicle-related incidents, electrical contact and structural collapse events, were reported relatively infrequently in both RIDDOR and non-RIDDOR data. This suggests that existing controls for higher-risk activities are generally effective, while the greatest opportunity for further injury reduction lies in strengthening the management of routine workplace hazards.

The prevalence of slips, trips and falls highlights the ongoing challenges presented by everyday site conditions, including uneven ground, poor housekeeping, adverse weather and muddy working environments. Despite being largely preventable, these incidents remain the single largest contributor to injury statistics across the sector. Likewise, the high number of lifting and handling injuries reinforces the physical nature of much of the work undertaken by AGS members and demonstrates the continued need for effective manual handling practices, task planning and the use of suitable lifting aids where practicable. Injuries resulting from flying objects remain a notable concern and may be associated with activities such as excavation works, drilling operations, plant use and the operation of hand tools. Continued emphasis on exclusion zones, equipment maintenance, safe systems of work and appropriate personal protective equipment is therefore essential.

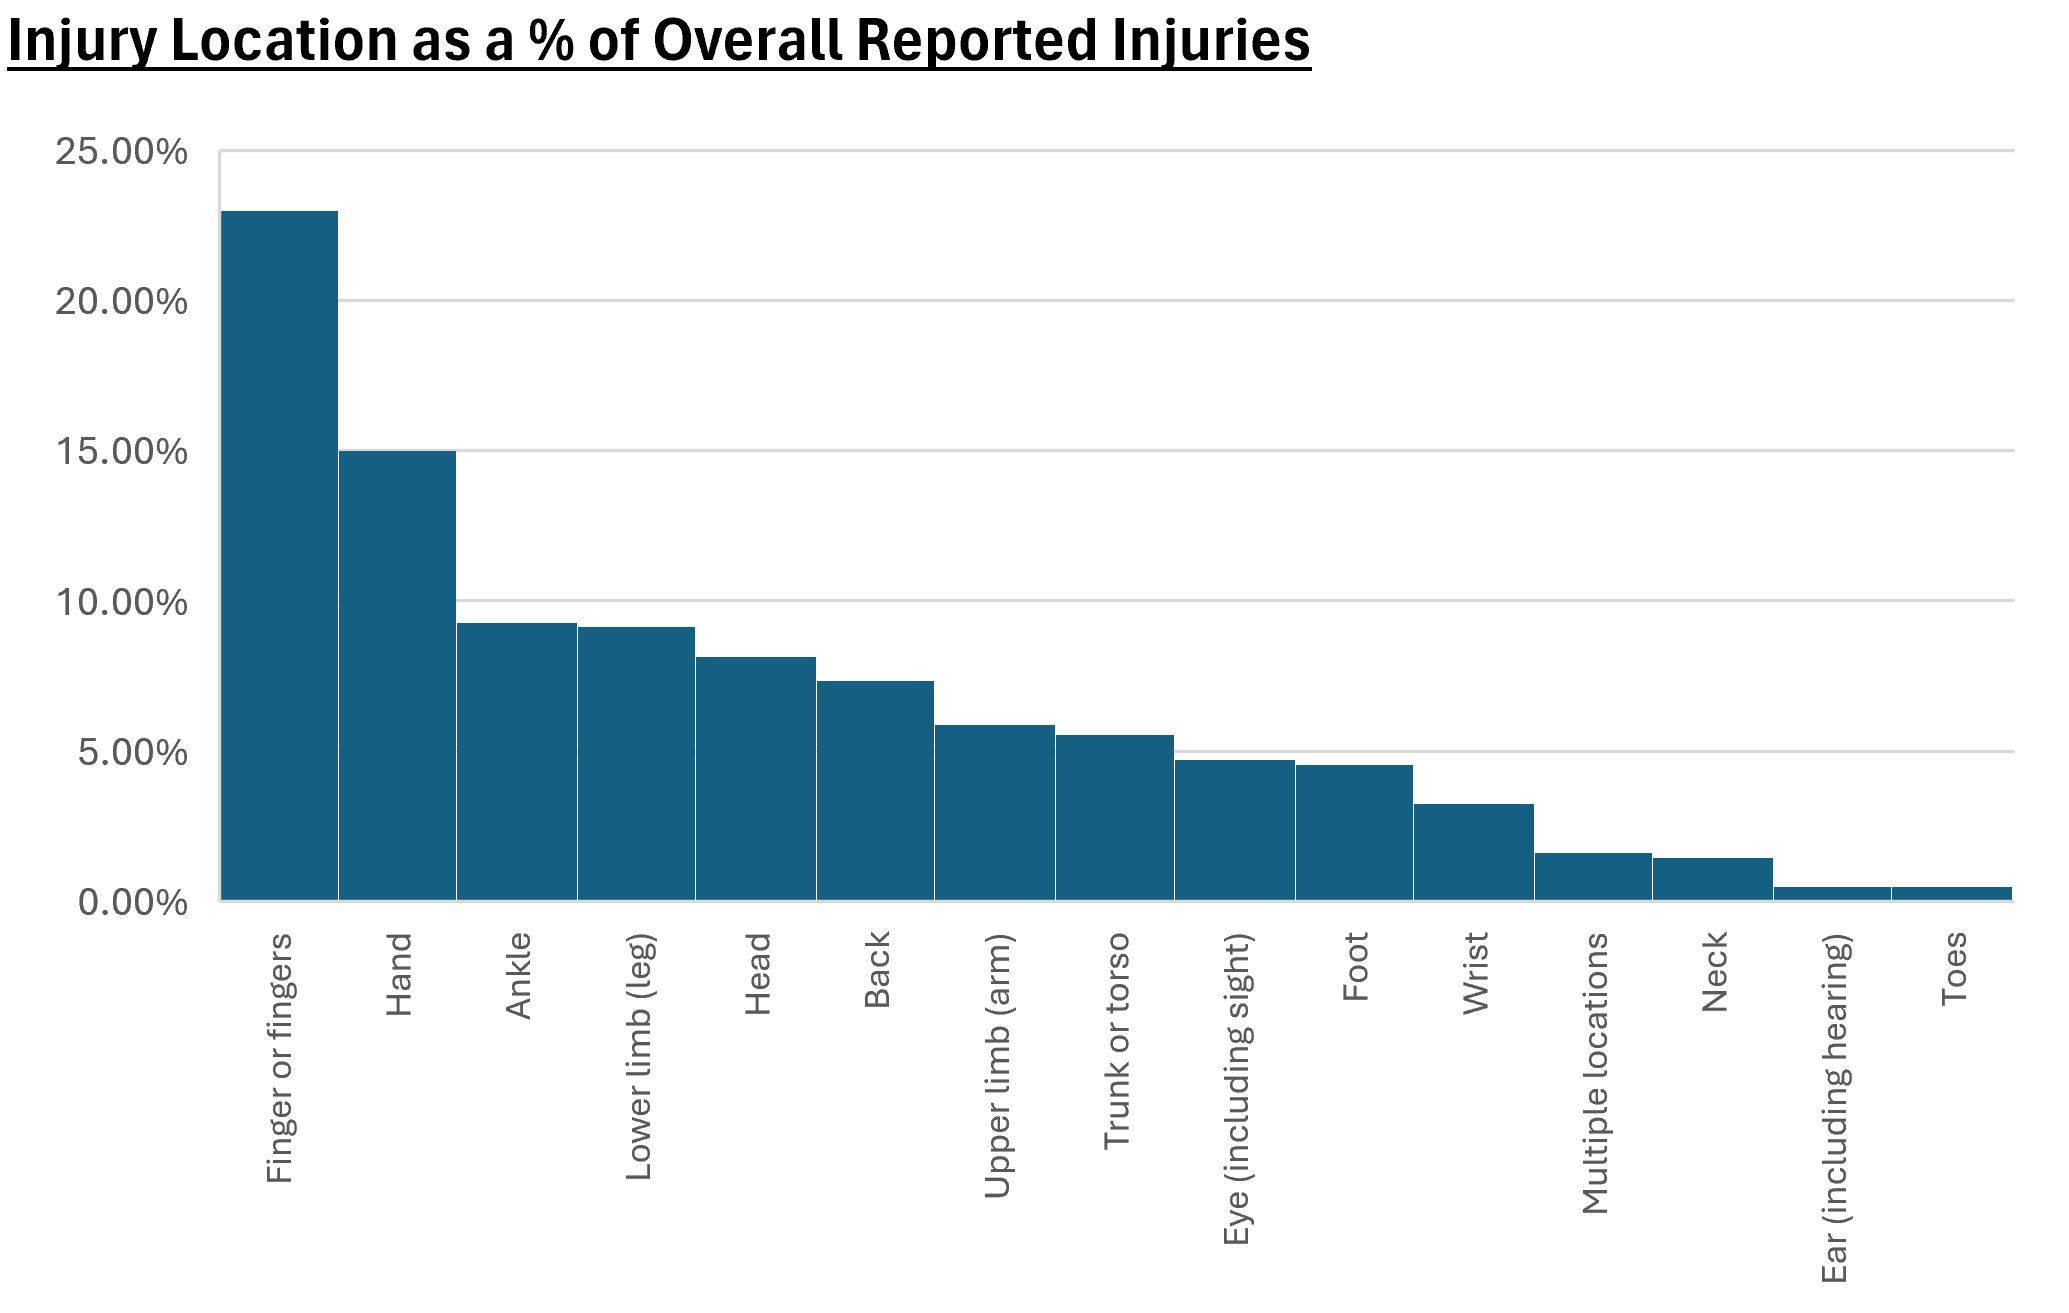
Analysis of injury locations further supports the findings from injuries reported by type. Injuries to the hands and fingers accounted for 38% of all reported injuries as seen in the graph above, making them by far the most affected parts of the body. This reflects the hands-on nature of the work undertaken across the industry and highlights the importance of maintaining high standards of manual handling, equipment operation and hand protection. Injuries affecting the lower limbs, including the legs, ankles and feet, accounted for a further 23% of reported cases and are likely linked to the high prevalence of slip, trip and fall incidents. Head and back injuries together represented approximately 15% of all injuries, reinforcing the importance of continued focus on site awareness, workplace organisation and ergonomic working practices.

Overall, the findings demonstrate that the greatest opportunity for reducing injury rates across the industry lies in preventing low-consequence but high-frequency incidents. By maintaining a strong focus on behavioural safety, risk awareness, workplace housekeeping, manual handling and routine task management, organisations can continue to reduce injury rates and further strengthen health and safety performance across the sector.

The Construction Industry

A comparison of the AGS Accident data with wider HSE non-fatal injury statistics for the construction industry, reveals both similarities and notable differences in the industry injury profile. In both datasets, slips, trips and falls on the same level remain the leading cause of injury, accounting for 36% of all AGS Member injuries compared with 25% across the industry as a whole. Similarly, lifting and handling incidents represent a significant proportion of injuries, accounting for 25% of AGS Member incidents compared with 17% nationally.

A particularly notable difference is the proportion of injuries caused by flying objects, which account for 19% of all AGS Member injuries, compared with 12% nationally for incidents involving moving, flying or falling objects. This likely reflects the practical and site-based nature of AGS Members’ work as previously mentioned. Conversely, falls from height account for just 1% of AGS Member injuries, significantly lower than the 20% reported across wider industry, suggesting that either exposure to work at height is comparatively limited or that controls in this area are proving effective.

Vehicle-Related Risk Remains Significant

Numerous organisations reported both own-fault and non-fault vehicle accidents during the reporting period. Given the significant amount of driving undertaken by AGS members to support site investigations, utility surveys, environmental monitoring, and the transport of laboratory samples (to name a few), vehicle safety continues to represent one of the industry’s highest exposure risks. Driving remains one of the most frequent occupational activities across the sector, and the continued occurrence of vehicle-related incidents within the survey results highlights the importance of maintaining strong driver safety initiatives, effective journey planning and ongoing risk awareness. Opportunities also exist to further reduce exposure to road-related risks through additional driver training and by promoting alternative travel methods where appropriate. For employees who do not require a vehicle for their role, greater use of public transport or other sustainable travel options may help reduce both driving-related risks and overall time spent on the road.

Near Miss Reporting Appears Healthy

Several organisations reported notably high numbers of near-miss incidents, with individual returns including 513, 300, 205 and 131 reports, alongside many other companies recording substantial reporting figures. While these numbers may initially appear concerning, they are generally indicative of a positive and proactive health and safety culture. Strong near-miss reporting creates valuable opportunities to identify hazards, investigate underlying causes and implement corrective actions before injuries or more serious incidents occur. The volume of near-miss reporting observed within parts of the industry may therefore reflect a maturing reporting culture, where employees are increasingly engaged in recognising and reporting unsafe conditions and behaviours. Continued encouragement of open reporting and shared learning will be key to further improving health and safety performance across the sector.

Mental Health Impacts Are Low in Number but Potentially High in Consequence

Most organisations reported zero lost working days attributable to mental health-related absences, suggesting that such cases either remain relatively infrequent across the survey population, or that under-reporting or classification differences may exist, with some absences potentially being recorded under other sickness categories rather than specifically as mental health-related absences. It could also mean that current mental health support measures may be proving effective, helping employees manage issues before they result in time away from work.

A small number of companies reported high levels of lost time, with some recording losses equivalent to as much as 6% of their total hours worked for the reporting period. While such cases remain relatively uncommon, the data demonstrates that when mental health-related absences do occur, they can have a considerable impact on both workforce availability and organisational productivity.

These findings highlight the importance of continued investment in employee wellbeing initiatives, mental health support and early intervention measures to help reduce the duration and severity of cases. Furthermore, the increasing number of participating employees and total hours worked represented within the survey enhances the value of the benchmarking exercise, providing a broader data set and strengthening confidence in the trends and conclusions identified across the industry.

AGS and BDA Collaboration

The AGS and BDA have continued to collaborate on accident statistics, with the ultimate aim of identifying common trends across the industry that can be explored and analysed further. As the accident statistics submitted to the AGS include data from both BDA and non-BDA organisations, this provides an opportunity to identify trends specifically amongst BDA members and compare these with those reported by non-BDA organisations, highlighting any notable similarities or differences.

Several non-BDA organisations reported substantially higher injury totals than the wider survey average, with as many as 354 minor injuries and 18 RIDDOR-reportable incidents, while other companies reported minor injuries in the 40’s. Although these figures indicate that some of the highest injury rates were recorded by non-BDA members, the data does not reveal any clear trend associated with BDA membership. A number of BDA organisations demonstrated healthy levels of near-miss reporting alongside relatively low injury numbers, which may be indicative of a proactive reporting culture and effective incident prevention measures. However, several of the highest near-miss reporting figures were also recorded by non-BDA organisations, suggesting that positive reporting behaviours are present across both groups.

Looking ahead to 2026-2027, the AGS intends to strengthen its collaboration with the BDA to facilitate the sharing of additional health and safety statistics from organisations that hold membership with both associations. This initiative is expected to improve the quality and reliability of data returns, providing a more representative picture of overall industry performance.

Continued engagement from AGS members remains vital, and we strongly encourage the submission of complete, accurate and up-to-date statistics to support annual review and analysis. This year, responses were received from 35% of AGS members, representing a 13% increase compared with the previous year. While this is a positive step forward, further participation is essential to ensure the data set is sufficiently comprehensive to provide a robust overview of health and safety performance across the industry. We remain optimistic that response rates will continue to improve, helping to drive greater engagement and deliver increasingly meaningful insights into industry health and safety trends.

Conclusion

The 2025 AGS health and safety data present a detailed snapshot of safety performance across the geotechnical and geoenvironmental industry, with increased participation further improving the quality and representativeness of the dataset. The findings show that most injuries continue to arise from routine workplace activities, particularly slips, trips and falls, manual handling tasks, and hand injuries, highlighting where the greatest opportunities for improvement remain. While larger organisations generally reported lower accident rates, the data suggests that medium-sized companies may benefit from additional support as they grow. Encouragingly, strong levels of near-miss reporting indicate a positive safety culture across much of the industry. Continued collaboration, transparent reporting and proactive risk management will be essential in driving further improvements in health, safety and wellbeing throughout the sector.

Article provided by Rachael Parry TechIOSH CMgr MCMI, Geotechnical Engineering Ltd Operations Support Manager

Article

Inside Groundsure – Q&A with Magdalena Wyrwas

- by
Tags: Featured

Name Magdalena Wyrwas

Job title Head of Insights

What company do you work for and what areas do they specialise in?
Groundsure is a leading UK environmental and climate data authority. We have 25 years’ experience giving land and property professionals expert information on risks, including land contamination, flooding and ground stability, as well as forward guidance on potential climate risks to advise their clients in the transaction process. We champion a customer-first ethos, by putting our customers at the heart of everything we do.

Where are your offices based?
Brighton, East Sussex and in Cornwall. We also have a number of home-workers – across the UK.

How many people does the company employ?
116 people.

How long have you worked at the company, and what inspired you to join?
I returned to work at Groundsure in 2022. What drew me back (and I believe that this is true for other colleagues who have returned), is the workplace culture, and the way that direct customer feedback drives the development and enrichment of our product offering. It’s rare to work somewhere that listens that closely to its customers, and I feel genuinely passionate about being part of the team that takes it forward.

What does a typical day look like for you?
In addition to managing the Insights Sales team day-to-day, I remain closely involved in direct conversations with the sector, capturing their needs and priorities and feeding them straight into the R&D and product development processes.

What project are you most proud to have been a part of? I’m very proud to have supported our product launch in July 2025: Groundsure Explorer – an environmental data workspace that brings together 170+ years of mapping history and 130+ datasets. Explorer swaps the traditional static PDF reports, for interactive, real-time data and maps, enabling a faster and more collaborative way of working for organisations and teams. Additionally, I’m involved in the customer product feedback sessions that we run for this product. These sessions provide a valuable opportunity to refine our products and tools and deliver greater efficiencies to users.

How important is sustainability within the company?
As a company focused on environmental issues, we’re aligned to the B Corp mission of using business as a force for good. Having B Corp certification, has helped us to shape our sustainability strategy and our conversations with customers and our teams within the business.

We achieved B Corp certification in September  2023, which enabled us to build and strengthen areas and also identify those areas where  more work is required. We’re in the process of recertifying under the new V2.0 scheme which is helping us build out our stakeholder collaboration  – including customers and staff collaboration, as we develop our approach to Net Zero and our inclusion practices.

How does your company support graduates and early career professionals who are entering the industry?
Our investment in people and our teams is always a key priority. We work with staff to develop their skills and support our employees to reach their career goals.

We have been challenged, particularly in the Cornwall area, (as it has areas of deprivation), in how we consider supporting young people and the local communities. In Cornwall, we offer internships to graduates from local universities, helping them to take their first steps into their careers. We’re particularly proud to be sponsoring one of the first Geoscience Graduate Apprentices in partnership with Keele University. This has been a positive experience for both the apprentice and the wider team.

What steps can companies make to improve the gender imbalance and diversity within their organisations?
A good starting point is to understand your current workforce diversity and set clear objectives for where you want to be. We found one of the most impactful ways to make Groundsure a comfortable place to work is to encourage staff to share their experiences – company wide. We’ve now completed two consecutive annual, anonymous Equality, Diversity and Inclusion surveys with all Groundsure staff. This helps us to understand who we are, and we use the results to support the development of the targets for the following year.

Why do you feel the work of the AGS is important to the industry?
The AGS has underpinned the geotechnical and geoenvironmental industry for decades, providing accessible, practical advice and guidance for practitioners and clients alike. It’s helped to raise industry standards and ensures that progress continues and evolves in alignment with the requirements.

Article Loss Prevention

Professional Indemnity Insurance: Asbestos Cover for Geotechnical and Geoenvironmental Consulting Engineers

- by
Tags: Featured

Professional indemnity insurance (PII) principally provides cover for liabilities arising from the negligent provision of professional advice or services. This article is intended as a discussion piece for professional consultants. Contractors responsible for the physical handling and/or removal of asbestos containing soils or materials, should consult their insurance brokers for advice.

For geoenvironmental and/or geotechnical consulting engineers, the presence of asbestos in soils or made ground is a risk consideration, especially in relation to the development of brownfield sites. It is therefore important for professional consultants to understand the extent of cover, if any, provided for asbestos-related claims under their PII policies.

The extent of cover provided for asbestos-related claims can vary considerably, and it is important for consultants to understand that no two PII policies are the same. Some policies may exclude cover for all asbestos related claims, and those policies that do provide cover will typically be subject to specific asbestos-related restrictions, limitations and/or exclusions, such as:

  • aggregate, costs inclusive, limits of indemnity;
  • cover limited to claims arising directly from negligence;
  • cover restricted to work undertaken in the UK, Isle of Man, Channel Islands and Republic of Ireland; and
  • bodily injury, illness and death exclusion.

Consultants should also check for specific exclusions relating to Environmental Audits and Asbestos Inspections, and whether such exclusions might apply to ground investigations.

It is worth noting that PII policies typically treat asbestos related claims separately from pollution and/or contamination claims, and the two areas of risk and cover should not be confused.

Understanding insurance policies and insurance terminology can be difficult and confusing, and consultants should therefore seek advice from their insurance brokers. It might also be helpful for consultants to specifically ask if and to what extent their PII policy might respond to claims arising under specific scenarios, such as the following.

  1. An omission to test for asbestos in soils or made ground.
  2. A ground investigation failing to identify the presence or extent of asbestos in the ground.
  3. A remediation scheme designed by professional fails to clear or make safe contaminated areas.
  4. A ground investigation, designed and directed by a professional consultant, disturbing asbestos materials.

It is of course important for consultants to secure the most suitable cover for their risk exposures, and where possible to transfer the risk to insurers. However, consultants should also consider risk management measures, including the use of formal terms of engagement, having a clearly defined scope of works, maintaining accurate written records, and the use of disclaimers, limitations and qualifications in reports.

If you have any questions about the contents of this article, please contact the author, Paul Livesey at Griffiths & Armour (plivesey@griffithsandarmour.com).

Whilst care has been taken in the production of this article and the information contained within it has been obtained from sources that Griffiths & Armour believes to be reliable, Griffiths & Armour does not warrant, represent or guarantee the accuracy, adequacy, completeness or fitness for any purpose of the article or any part of it and can accept no liability for any loss incurred in any way whatsoever by any person who may rely on it. In any case any recipient shall be entirely responsible for the use to which it puts this article.

Article Sustainability

Collaboration for the future: practical sustainability guides for our sector

- by
Tags: Featured

Sustainability is a great catch-all term, covering everything from carbon reduction and water use through to wellbeing and inclusion. But this breadth also presents a challenge. How can an engineer, or a procurement lead, or a yard technician improve sustainability? What does sustainability even mean for our day-to-day work?

Recognising this challenge, the European Federation of Foundation Contractors (EFFC) and Deep Foundations Institute (DFI) have been collaborating to produce a series of free sustainability guides specifically for the geotechnical sector. The EFFC represents foundation and geotechnical contractors across Europe, while DFI represents geotechnical specialists mostly in North America, as well as Europe and India. The working group is co-chaired by Luke Deamer (Keller and EFFC) and Kimberly Martin (Keller and DFI).

Each free guide uses four questions to help geotechnical employees improve sustainability:

  1. What is the area of sustainability? What does it mean to geospecialists?
  2. Why does it matter? What drivers, or value, is behind these initiatives?
  3. How can geotechnical companies and individual employees improve that area of sustainability?
  4. Measure – What metrics can we use, at a company and project level, to measure their progress and set targets?

Importantly, the approach underpinning the guides aligns directly with the AGS Sustainability Charter. Both take an initiative-focused approach, using the United Nations Sustainable Development Goals (SDGs) as a common language to prioritise sustainability topics.

More generally, the EFFC/DFI guides are not written as standards or minimum requirements. Instead, they are practical support documents that share good practice and help organisations identify actions that are appropriate for their own circumstances.

What areas of sustainability are covered?

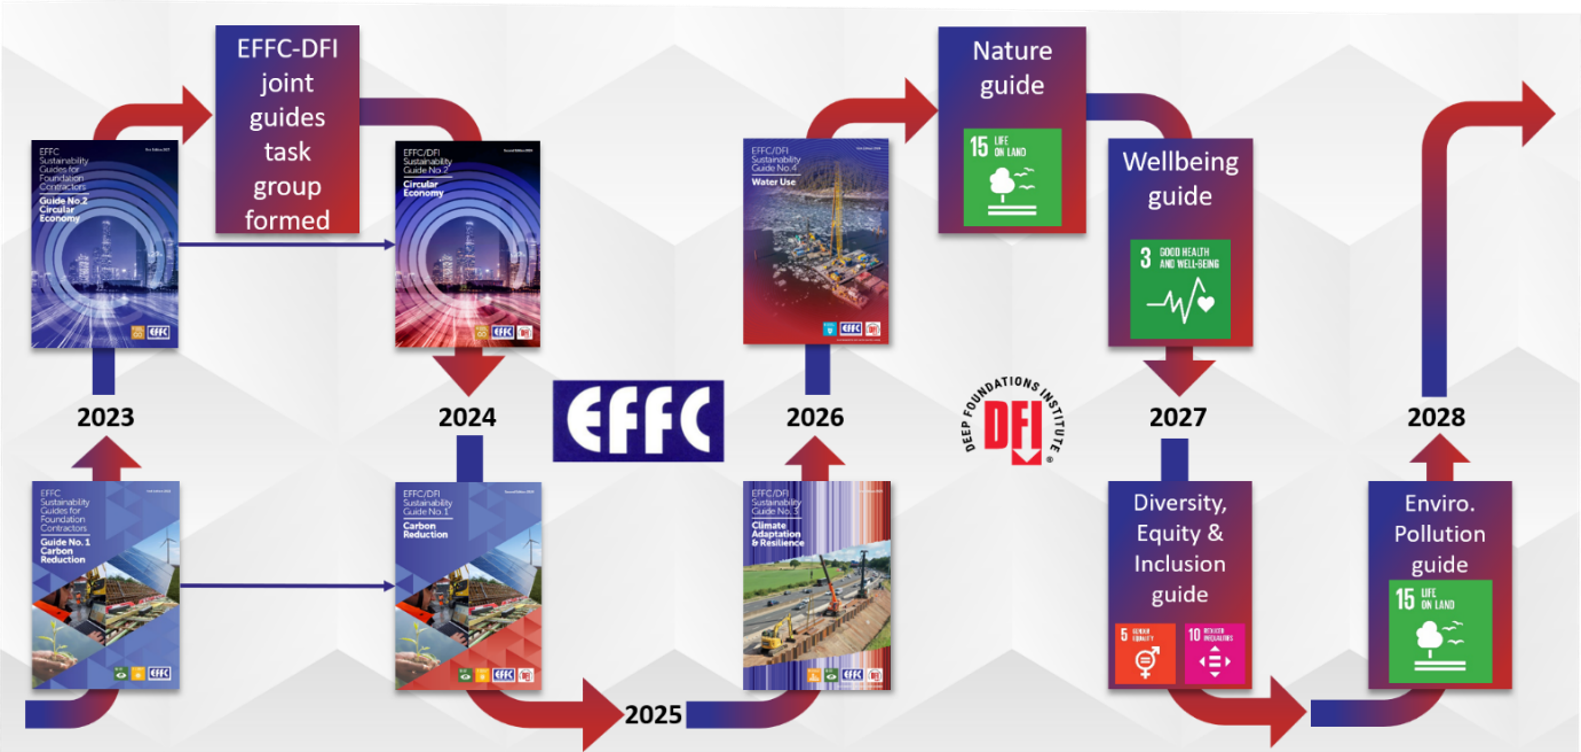
So far, the EFFC and DFI have published four sustainability guides, each focused on a specific sustainability topic that is material to geospecialists.

Carbon reduction

The first guide focuses on carbon reduction, addressing SDG 13 (Climate Action) and SDG 7 (Affordable and Clean Energy). Led by Luke Deamer, who is also an honorary member of the AGS sustainability working group, this guide focuses on carbon savings throughout site investigation, design, operations and office / maintenance yard work. Given the focus on carbon saving in our sector, this guide acts as a signpost to understand concepts, legal requirements, standards and of course practical carbon saving improvements. Later additions include case studies that bring these improvements to life.

Circular economy

The second guide focuses on the circular economy, supporting SDG 12 (Responsible Consumption and Production). The circular economy looks to encourage the use of secondary materials, extend product lifetimes and reduce waste at the end of life. Led by Alice Berry (formerly at Arup and EFFC), this looks to go beyond the typical focus on waste and recycling, instead broadening the approach to include improving resource efficiency and building for reuse. Much like the carbon reduction guide, case studies and a focus on facilitating foundation reuse reflect the research of EFFC and DFI members around the world.

In terms of geoenvironmental work, there is considerable crossover with remediation specialists as we look to minimise waste disposal, maximise material reuse and reduce environmental impacts associated with contaminated land management.

Climate adaptation and resilience

The third guide addresses climate adaptation and resilience, supporting SDGs 11 (Sustainable Cities and Communities) and 13 (Climate Action). Unlike carbon reduction, which focuses on mitigating climate change, adaptation focuses on preparing for the consequences of a changing climate. Led by Marla Gillow, originally a member of the AGS sustainability working group, this took two very different forms. The first of these focuses on how geotechnical designs and specifications should adapt as climate-related hazards change. The second focuses on how geospecialist contractors will be impacted by climate change directly and, therefore, how we need to adapt our operations.

Water use

The most recent guide focuses on water use, supporting SDG 6 (Clean Water and Sanitation). Water is a critical but often overlooked aspect of sustainability, with many of the initiatives taken from water-scarce regions. Construction activities can consume significant quantities of water while also affecting groundwater, surface water and wider catchment systems. Led by Alice Liddell (Sizewell C and EFFC), the water guide looks at minimising water use, groundwater interactions and avoiding water contamination throughout geotechnical projects. The guide explores practical opportunities to reduce water consumption, improve management practices and consider water risks during design and construction.

Looking Ahead

The sustainability journey does not stop here. Three more guides are currently in drafting stage. These upcoming EFFC/DFI guides are being developed to cover the following:

Nature

Led by Cerys Orriss (Aarsleff and EFFC), the nature guide focuses on how contractors and designers can influence nature and biodiversity on their projects. Currently nearing review stage, the guide focuses on core concepts and requirements around nature, supporting SDG 15 (Life on Land). Particularly given the biodiversity net gain requirements on UK projects, the guide has benefited from AGS input on minimising impacts on soil and groundwater ecosystem services.

Wellbeing

Led by Catherine Chauder (Keller and DFI), this guide focuses on wellbeing initiatives for site and office teams. Built from a collection of case studies from around the world, it covers the breadth of wellbeing, from mental and physical health through to financial and social wellbeing, supporting SDG 3 (Good Health and Well-Being). Given the challenges of site and field work, the guide has a particular focus on initiatives that reach field operators.

Gender equality and reduced inequalities

Led by Bradley Falcus (Central Alliance and AGS member), this guide will be the first to formally include AGS as a collaborator with the EFFC and DFI. This guide focuses on inclusion commitments for geospecialists, focusing on improving diversity and the benefits of an equitable approach for everyone in a company. Supporting SDGs 5 (Gender Equality) and 10 (Reduced Inequalities), this guide focuses broadly on gender equality, but also includes other protected characteristics such as disability, race and religion.

These upcoming guides reinforce themes already reflected within the AGS Sustainability Charter, promoting a broader understanding of sustainability that extends beyond environmental impacts to include people, communities and inclusion.

Why do these guides matter to AGS members?

Sustainability is increasingly becoming a business necessity, part of our licence to operate. The EFFC/DFI guides explain that there are multiple drivers for AGS members to improve sustainability.

Legislation

Across the UK, Europe and internationally, there are many legal requirements that impact geospecialists. This spans a broad range of standards, from corporate sustainability reporting, climate disclosures and carbon management, through to environmental performance requirements or engine air quality standards.

Even where legislation does not apply directly to smaller organisations, client requirements frequently pass expectations down through procurement processes and contractual obligations. The guides help make sense of these requirements, highlighting the key points for our sector.

Client demand

Client demand provides a financial incentive for geospecialists to improve sustainability. Whether it’s recognised directly as a weighted percentage of a tender or just a minimum standard to bid on a project / join a framework, public and private sector clients are pushing sustainability in tender documents.

Employee attraction and retention

Sustainability is also increasingly important to employees. As our sector struggles to attract the next generation of employees, sustainability is an increasingly important factor in attracting and retaining talent.

Beyond recruitment and retention benefits, there is a compelling ethical argument. Our sector helps shape the built environment for future generations. We are a carbon- and resource-intensive sector, putting a small, highly-skilled workforce in challenging physical and mental environments. This means we have a responsibility, and a real opportunity, to make a genuine difference for our own workforce, our local communities and the planet overall.

Efficiency

Anything that saves fuel, materials or time ultimately also saves cost. When we think of improvements, often we jump straight to the latest innovations in low carbon technologies, like electric equipment or ultra-low carbon cements. But there are many cheaper, often simpler, improvements we can make first. Many of the guides therefore provide hierarchies or improvement cycles to help prioritise these efficiency savings first, before adopting more innovative technologies.

Banks, investors and insurers

Financial institutions are increasingly assessing sustainability performance when making investment, lending and insurance decisions. Environmental, Social and Governance (ESG) performance is becoming an important indicator of long-term business resilience. Whether it is sourcing green funds for a project, minimising climate risk for insurers or preferential loans based on sustainability performance, these drivers translate sustainability performance into financial savings. For AGS members seeking investment, growth or major project opportunities, sustainability performance is therefore becoming an increasingly relevant commercial consideration.

How can we all make a difference?

One of the greatest strengths of the EFFC/DFI guides is their practical structure.

Rather than discussing sustainability at a purely strategic level, the guides break actions down by business function, helping individuals understand how sustainability relates directly to their role. These improvements are not just limited to engineers either, with advice from HR and procurement leads, through to health & safety and even IT teams. Everything is focused on making sustainability practical and actionable.

Every ‘how’ section begins with quick wins for companies looking to make a start on this area of sustainability. They also end with ‘future looking initiatives’ for those companies that are looking to innovate in these areas of sustainability.

The guides frequently demonstrate that improvements require collaboration across functions. For example, reducing carbon may require design optimisation, procurement engagement and operational changes simultaneously. Similarly, improving circularity can involve designers, remediation specialists, contractors and waste managers, all working together.

Measuring our progress

One of the key focus areas shared by both the AGS Sustainability Charter and the EFFC/DFI sustainability guides is that we need to be able to measure our progress on sustainability.

The guides therefore include metrics and indicators that can be used to monitor progress. Grounded in legislation requirements, standard specifications and geotechnical-specific datapoints, these provide a way to track progress against the initiatives in the guides. Given how we operate as a sector, these metrics are broken down into those for a project level, as well as those at a company level.

EFFC/DFI carbon calculator

Perhaps the most visible example of standardised measurement within the sector is the EFFC/DFI Carbon Calculator. Developed collaboratively by the EFFC and DFI over a decade ago, the calculator enables geotechnical companies to compare the footprint of geotechnical works to using a certified, consistent methodology. This consistency in calculation between geotechnical companies improves transparency and helps clients compare alternative solutions on a common basis. It also enables benchmarking activities, establishing estimated carbon footprints of different geotechnical solutions.

The calculator is currently being digitised in collaboration with Carbone 4. In the meantime though, it has been recognised by the EU as the only sector-specific carbon calculator in EFRAGs recommendations for small and medium enterprises. It has also therefore been written into specifications across Europe, from France to the Netherlands, as a standardised way to calculate and compare carbon emissions.

The EFFC/DFI Carbon Calculator has contributed to a number of calculation initiatives, including the AGS’s own efforts to promote simplified carbon calculations in the geo-environmental sector. Whilst foundation emissions are always an order of magnitude greater than those from ground investigations, both tools are useful for standardising and simplifying carbon calculations.

Conclusions

Ultimately, the EFFC/DFI guides aim to make sustainability practical, actionable and relevant to everyone working in our sector.

The EFFC/DFI sustainability guides provide AGS members with a practical, accessible and free resource to support that journey. Whether the goal is reducing carbon, improving resource efficiency, adapting to climate change or managing water responsibly, the guides help translate sustainability ambitions into tangible actions. By combining practical guidance and case studies with measurable outcomes, they offer a valuable framework for geospecialists, particularly if we’re looking to align with the AGS Sustainability Charter.

A big thank you goes to all the volunteers that have helped write these guides. Particularly, we must give a shout out to the AGS members that have contributed, including Alison Nicholson, Bradley Falcus, Marla Gillow and Chris Swainston. If you would like to be involved in the upcoming guides, particularly on wellbeing or gender equality and reduced inequalities, please contact Luke Deamer or Kimberly Martin.

You can download the guides for free from here: EFFC Sustainability Guidance Archives

There are plenty of webinars summarising the guides to date. You can view these for free on the EFFC or DFI’s website here: EFFC Webinars

Article by Luke Deamer, Group Sustainability Director, Keller

Article Geotechnical

Guidance on SPTs terminated early, extended tests and reporting of seating blows

- by
Tags: Featured

This guidance note on standard penetration test (SPT) procedure and reporting covers some issues that have recently arisen, specifically:

  • Procedure for tests terminated early, including a possible conflict between BS EN ISO 22476-3 and guidance from the British Drilling Association (BDA).
  • Reporting for tests terminated early, on logs and in AGS data.
  • Extending SPTs to 100 blows in soft rock and other materials.
  • Reporting of seating blows, on logs and in AGS data including discussion of BS EN ISO 22476-3 requirements.

Procedure for tests terminated early due to bouncing or similar

For the purposes of this guidance ‘terminated early’ refers to a test that has been stopped before any of the normal criteria for completion have been achieved, i.e. 300mm penetration or 50 blows for the main drive.

The BDA document Guidance For The Operation Of Cable Percussion Rigs And Equipment (Issue 2.7, 2024) includes the following:

“Where double hit or bouncing occurs or there is no penetration for 25 blows the test should be aborted and the total penetration reported, and test ‘refusal’ noted.”

This guidance can be perceived as being in conflict with the requirements of the test standard (BS EN ISO 22476-3 :2005+A1:2011 current at time of writing) which is silent on provision for early termination prior to 50 blows for the main test drive.

It is recommended that a common-sense approach is adopted when double hit or bouncing or similar occurs. If, based on understanding of the prevailing ground conditions and observations during the test, there is good reason to believe that continuing the test will not lead to further penetration and/or there is a risk of equipment damage, then it is considered reasonable and correct to terminate the test early. Reporting of this is covered in the next section.

The Investigation Supervisor should be informed at the earliest opportunity and the matter discussed, including agreement on action to be taken should the same situation arise again.

In making this recommendation it has been recognised that the most important information obtained in such cases is the observation of bouncing (or similar), i.e. something resistant to penetration has been encountered in the ground. This may be indicative of an obstruction that the design will need to consider, or that constructors need to be aware of.

In situations such as this, the SPT N value that may be interpreted based on actual penetration for a particular number of blows will rarely be useful for design. Such data points would normally be disregarded when interpreting a design line. Therefore, there is no merit in risking equipment damage merely to satisfy a very strict interpretation of the standard.

Requiring a contractor to redrill a borehole, despite that contractor following BDA guidance, would not be a common-sense approach.

Reporting for tests terminated early

Where a test has been terminated early in accordance with the above, this fact should be clearly indicated on borehole logs and/or test reports.

BS EN ISO 22476-3 reporting requirements include:

“all unusual events or observations during the operation (e.g. low blow count, penetration without blows, temporary obstructions, malfunction of the equipment);”

AGS does not offer any specific recommendation on the format or wording of such observations other than it should be clear and concise. This should be provided in addition to the usual reporting of blow count and penetration information.

For digital data supplied in the AGS data format*, it is recommended that the ISPT_REM field is used for reporting additional comments or observations.

However, data producers must ensure that this information is also shown on the logs produced from their data management software. If the log report forms do not show ISPT_REM data then there may be merit in duplicating this data in a field that will be seen on the logs, e.g. DREM_REM. Duplication is far from ideal but this is better than having this important information omitted from the logs.

Extending SPTs to 100 blows

BS EN ISO 22476-3 states:

“If a total of 50 blows for the test drive is reached, the test may be finished (N = 50); in soft rocks it can be increased to 100 blows (N = 100).”

Normal practice in the UK is to finish the test at 50 blows in all cases, unless extending to 100 blows has been specified, or there is a specific prior agreement to continue.

Specifiers should only consider extending to 100 blows when this will clearly and justifiably benefit the design. As suggested by the standard, one such case is weak rocks.

Another example, witnessed by the author on several projects, is extending to 100 blows in Thanet Sand, a very dense over-consolidated silty sand. Here the SPT results were used alongside other more precise (but expensive) tests to help identify design critical changes in clay/silt content with depth.

Blow counts > 50 may be encountered in very stiff clays. However, SPT are not normally extended in such conditions because extrapolation of the N value to account for early termination is usually found to be sufficient. Such extrapolation should only be undertaken by the designer, who will need to be mindful of its limitations.

Reporting of seating blows

BS EN ISO 22476-3 requires the incremental blow counts for the main drive to be individually reported. Either two or four increments may be used. Traditionally, in the UK we have reported four x 75mm increments, in accordance with the original BS 1377 Part 9.

For the seating blows BS EN ISO 22476-3 requires 150mm penetration or maximum of 25 blows. However, it also requires the seating blow count/penetration to be reported as one increment, not two as per past (and current) UK practice.

Therefore, a BS EN ISO 22476-3 compliant result reported on a log may look like this, using five increments:

“N=16  (9/4,3,4,5)”

whereas a traditional UK log may report the same in this format, using six increments:

“N=16  (4,5/4,3,4,5)” or “N=16  (4,5,4,3,4,5)”

Despite BS EN ISO 22476-3 having been published for many years now, it appears that the specific requirement for reporting seating blows has not been commonly adopted. However, it also appears that few have noticed. It is also fair to say that it is a relatively minor issue in the grand scheme of things.

It is considered that forcing a change in SPT reporting format across the industry is likely to lead to disruption and confusion, with no obvious benefit. Furthermore, it is possible that a future revision or clarification of the standard may permit reporting in six increments.

The recommendation is that both the five and six increment methods are acceptable, but one of these should always be applied consistently within a given report.

It is recommended that “/” is used as the separator between seating and main blows, with “,” separating the main blows, as shown above. This should provide a helpful visual cue for UK users used to interpreting the first increment(s) as seating.

In AGS format data, by rule the main blows/penetrations are reported in increments 3, 4, 5 and 6 as required, with increments 1 and 2 reserved for seating. If the BS EN ISO 22476-3 five increment system is used then seating should all be in increment 1 with increment 2 unused (blank/null entries preferred to make it clear), i.e. the total seating blows in ISPT_INC1 and the total seating penetration (normally 150mm) in ISPT_PEN1. Main blows then start at increment 3 as normal.

* In accordance with Association of Geotechnical & Geoenvironmental Specialists publication Electronic Transfer of Geotechnical and Geoenvironmental Data, AGS4, Edition 4.1.1 – March 2022 , or earlier editions thereof.

Article by Neil Chadwick, Director at Digital Geotechnical Ltd

Article Geotechnical

Horizontal Directional Drilling

- by
Tags: Featured

Horizontal directional drilling (HDD) is a form of trenchless crossing that is used to install utilities (e.g. power cable ducts and pipelines) beneath roads, railways, rivers and other sensitive land uses with minimal disruption compared with other forms of construction. It is an established technique with successful installations internationally as well as in the UK.

How does it work?

  1. Launching and receiving sites are established at the exit/connection points of the HDD installation.
  2. A pilot bore (typically 150mm dia) is drilled on a parabolic arc from one side to the other. The technique is fully steerable in the horizontal and vertical planes. For increased lengths, straight lengths can be incorporated within the overall drill profile. Depending on ground conditions, installation technique and site access, lengths of several km are possible.
  3. After the pilot drill has punched out at the exit pit, a back reamer is attached and pulled back through the drill shot to enlarge the bore. Various drilling fluids may be used including water, polymers and bentonite.
  4. Progressively larger reamers are utilised until the final bore size is achieved. Final bore diameters generally range from 6” (152mm) to 26” (660mm) but can be up to 48” (1219mm).
  5. Once the bore is at the required diameter the final duct(s) / pipe is pulled through the bore before being cleaned and temporarily capped at both ends. The duct(s) / pipe is then ready to be connected to the rest of the network, which is typically at a nominal depth (<1.2m).

Typical Parameters

The bend radius is a function of tooling used and pipe being installed. On small scale rigs in soft ground a radius as tight as 75m can be achieved whereas large diameter bores or rock tooling requires bend radii in excess of 400m. Plastic pipes require bend radii of 25 times outside diameter typically. In contrast thin walled steel pipes require a radius of 1000 times outside diameter.

The length of a drill shot can vary significantly but is typically 60 – 250m. Longer drills (several hundred metres) are possible and typically required for landfall projects where offshore cables join onshore networks. Drill lengths of 1 to 3 km are now becoming more commonplace.

The drill can bend in the vertical AND horizontal planes. If undertaking a compound bend (vertical and horizontal at the same time) then individual bend radii should be reduced so that the overall bend remains within tolerance.

Drilling fluid

Throughout the drilling process, drilling fluid or ‘mud’ is continuously pumped into the bore via the drill head / reamer primarily to stabilise the bore and transport cuttings back to the entry pit. The mud recipe and pump rate is critical to ensure a successful HDD:

  • Too viscous means higher pressure required to move the cuttings, thereby increasing the risk of heave
  • Too fluid and the bore may be unstable and subsequently manifest as excessive settlement.
  • A mud mixture is site specific and tailored to the ground and groundwater conditions anticipated.

Key advantages of HDD

It is trenchless! Closing a motorway or railway to install a utility is often not a feasible option. Traverses below canals, rivers and subsea installations are also possible with this technology.

HDDs create very little disturbance at the surface. The entry pit is typically of the order of a few metres in length and width and a nominal 1m depth. The exit pit is usually similar unless there are significant elevation differences. The limited excavations have a notably less environmental impact than an equivalent trenching option.

Trenching often creates a soft line in the ground due to inadequate compaction during the backfill process, akin to trial pitting during a GI. This leads to ongoing settlement and possibly abrupt changes in surface level that could pose risks to users (e.g. drivers). In contrast, the settlement profile that may develop post HDD construction is generally much more gradual, if any movement is experienced at all, due to the ground being much less disturbed. Settlement of <5mm is common.

All HDD works are undertaken by personnel at the surface. This has clear safety benefits by eliminating the need for deep shafts or excavations that would be required for other trenchless techniques such as microtunneling

Key constraints of HDD

HDDs should not be considered a silver bullet and have two principal limitations: coarse ground conditions and space to string out the pipe / ducts.

The drilling process is versatile and can successfully drill through a variety of ground conditions including soft ground and rock. However, coarse ground conditions (coarse gravel and cobbles) can be particularly challenging. Bores in such ground conditions can be unstable, which causes further overbreak and potentially manifesting as increased settlement at the surface. The usual method of mitigating this issue is to install a casing through such ground conditions, akin to cable percussion drilling.

Boulders can also be problematic by causing the drill to deflect from the intended trajectory. It can sometimes be feasible to partially withdraw and then steer around the boulder. However, usual practice is to try again nominally offset from the issue – similar to cable percussion drilling!

The second limitation is associated with site practicalities. Only small diameter ducts can be transported to site on a reel. All other ducts and pipes require welding on site to create the pipe string. The length of the pipe string is equal to the length of the drill and therefore can be hundreds of metres long. There needs to be space on site to laydown the completed pipe string prior to pull back. Due to the flexibility of the pipe it can snake past obstacles while strung out as illustrated in Figure 1.

Figure 1:  Example of pipe sting out prior to pullback

Steering – How accurate is it?

There are three ways of steering an HDD:

  • Walkover locating using a radio sonde
  • Magnetic wireline
  • Gyro

The walkover as the name suggests involves a person with a hand held device receiving a signal that is transmitted from the drill head. This locates the drill head and allows steering adjustments to be made. Due to the walkover nature of the technique it is limited to simple low risk crossings.

The wireline system involves laying a surface tracking grid that emits an artificial magnetic field that the drill head uses to provide a precise location. A grid is often required on both sides of the crossing with the middle part effectively being ‘blind’ as the drill passes from one grid to the other.

The best form of steering is the Gyro, which has an accuracy of 0.01°. From previous experience on long drills (>200m) this can be considered to be centimetre accurate at worst. However, the high accuracy attracts a similar price tag and is therefore reserved for the long or complex drills.

What can go wrong?

A principal risk on all HDD projects is the frac out of fluids during drilling, which is intrinsically linked to surface heave. Frac out is ultimately due to the downhole pressure exceeding the confining pressure which results in fluid travelling upwards and eventually out at the surface. In the event of a frac out it should be contained (example below) and then cleared away.

Figure 2:  Example of surface frac out and subsequent containment

Excess pressure can be caused by:

  1. Collapse of the bore behind the drill head stopping the drilling fluid flushing the bore
  2. Cuttings remain in the bore due to insufficient fluid rate
  3. Incorrect drilling fluid recipe
  4. Heavily fractured or fissured ground conditions providing preferential pathways

Calculations can be undertaken with commercially available software to assess the risk of frac out. The risk is highest during pilot drilling due to the smaller annulus between the bore and drill pipe. The results should be considered guidance only and just because it suggests frac out will occur it doesn’t mean it will, and vice versa. There is often a risk close to the exit pit where drill pressures remain relatively high and cover thickness is minimal.

HDDs also have the potential to cause ground movement, which may manifest as settlement at the road surface or beneath existing buried utilities. Relatively simplistic formulae are used to estimate the long term settlement trough.

The size of the trough is a function of ground conditions and depth of cover. Cohesive soils produce wider troughs but a smaller maximum settlement (smax) when compared to non-cohesive soils. Similarly, installing the drill at greater depth reduces smax but widens the trough.

Early Contractor Involvement

Engaging early with a specialist contractor is highly recommended. The contractor can advise on the suitability of an HDD versus other techniques. This will likely include conceptual design to estimate length and depth of any drill. Consequently, they should also provide input into any ground investigation scope.

Article provided by Angus Wilson, Geotechnical Manager, AMS No-Dig

Article

Three Voices, One Industry: How Storytelling Can Help Secure the Future of Ground Engineering

- by
Tags: Featured

Engineering has the power to shape lives, communities and futures. Every day, geotechnical and geoenvironmental professionals contribute to safer homes, resilient infrastructure, sustainable development and thriving communities.

Yet despite the critical role engineering plays in society, many young people still struggle to see themselves within the profession.

For those from underrepresented backgrounds, the challenge can be even greater.

If people cannot see themselves reflected in an industry, it can be difficult to imagine that they belong there.

At a time when the engineering and construction sectors continue to face skills shortages, an ageing workforce and increasing technical complexity, this is a challenge that affects all of us.

The future success of ground engineering depends not only on technical excellence, but on our ability to attract, retain and develop the widest possible talent pool.

Representation, visibility and belonging are therefore not simply Equality, Diversity and Inclusion issues.

They are industry issues.

Three voices. One shared purpose.

Chai & Chat Engineering was created from a shared belief that engineering should be visible, relatable and accessible to everyone.

The podcast is hosted by three engineers whose careers span geotechnical engineering, infrastructure delivery and major programme leadership. Although they work in different parts of the industry, they share a common experience: each has spent significant parts of their career as one of very few people who looked like them in the room.

Dipalee Jukes

Dipalee Jukes is a geologist, ground engineer and entrepreneur, and co-founder and CEO of Ground & Water, a geotechnical and geoenvironmental engineering consultancy established in 2009. With more than two decades of experience in the industry, she is a passionate advocate for inclusive leadership, developing people alongside projects and creating businesses that deliver both technical excellence and social impact. Alongside her work in ground engineering, she is involved in mentoring, school governance and wider industry initiatives focused on gender equality and representation.

Era Shah

Era Shah is a Chartered Civil Engineer and programme management professional working across the infrastructure and built environment sector. Her experience spans complex infrastructure delivery, transformation programmes and strategic programme management. Beyond her professional role, she actively supports future generations through mentoring, STEM outreach and trustee work, championing both technical excellence and social responsibility.

Malika Kapasi

Malika Kapasi brings over two decades of experience in major infrastructure and transport programmes. As a planning director and commission lead, she works at the intersection of project delivery, governance and strategic leadership. Through Chai & Chat Engineering, she is passionate about sharing the often unwritten lessons of leadership and demonstrating that diverse voices belong at the highest levels of engineering decision-making.

Together, the three co-hosts represent different technical disciplines, sectors and career paths. What unites them is a shared desire to help create an industry where future generations see engineering as a place where they belong.

From a chance meeting to a global platform

The origins of Chai & Chat Engineering can be traced back to London Build Expo in 2021.

The three co-hosts met for the first time at the event and quickly discovered common experiences despite working in different parts of the industry. Conversations about careers, visibility, leadership and identity revealed striking similarities in their personal and professional journeys. Each had experienced periods where they felt like outliers in engineering spaces. Each had questioned whether they truly belonged. And each recognised how powerful visible role models could have been earlier in their careers.

From that conversation emerged a simple idea.

What if there was a platform where honest discussions about engineering, leadership and lived experience could take place?

What if the stories often missing from industry narratives could be brought to the forefront?

That idea became Chai & Chat Engineering, which launched in October 2022.

Today, the podcast reaches listeners in more than 37 countries and has become a growing platform for conversations about engineering careers, leadership, resilience, inclusion and the future of the profession.

Why conversation matters

The podcast takes its inspiration from the cultural tradition of sharing stories over a cup of chai.

At its heart is a simple belief: conversation has power.

Engineering is often presented through a technical lens. We discuss specifications, standards, designs, risk assessments, site investigations and project delivery. These are fundamental aspects of our profession. Yet engineering is just as much about people as it is about projects – creativity, teamwork, communication and the ability to turn ideas into impact.

And, behind every project is a human story.

For many young people, engineering remains an unknown career. They may have heard the term “engineer”, but have little understanding of what engineers actually do, how they entered the profession or what opportunities exist within it.

This is particularly true for specialist disciplines such as engineering geology, geotechnical engineering and geoenvironmental consultancy.

Stories bridge that gap.

When people hear authentic accounts of career journeys, setbacks, successes and lessons learned, engineering becomes more human and more accessible.

It becomes easier to imagine a place for themselves within it.

The support of the Institution of Civil Engineers

In 2026, the Institution of Civil Engineers recognised the impact of Chai & Chat Engineering through an article titled Three Voices, One Industry, A Shared Goal: Help Others See Themselves in Engineering. The article explored the podcast’s mission to widen participation and help individuals from underrepresented backgrounds see engineering as a profession where they belong.

The ICE highlighted the podcast’s focus on open and honest dialogue, describing how the three hosts had created a platform that challenges perceptions of who belongs within engineering and the built environment. It recognised the importance of creating welcoming spaces where conversations about careers, leadership and lived experience can take place openly.

The support received from the ICE has been significant.

It demonstrates that attracting future engineering talent is not solely about promoting technical careers. It is also about building connections, raising visibility and showcasing a broad range of voices and experiences.

The role of representation in tackling skills shortages

Ground engineering faces many challenges.

Climate change adaptation, sustainable development, renewable energy infrastructure, brownfield regeneration and increasingly complex geotechnical risks all require highly skilled professionals.

At the same time, the wider engineering sector continues to experience challenges around recruitment and retention.

The profession therefore needs to appeal to a broader audience than ever before.

Research consistently demonstrates that diverse teams bring benefits including stronger decision making, increased innovation and improved organisational performance. Diverse teams also better reflect the communities that engineering ultimately serves.

The challenge is not simply encouraging more people to enter the profession.

It is ensuring that once they arrive, they feel they belong.

Many of the guests featured on Chai & Chat Engineering have spoken candidly about imposter syndrome, confidence, leadership and career progression. These conversations reinforce an important truth: creating inclusive cultures is not solely about policies and programmes.

It is about people.

People who feel valued are more likely to stay.

People who feel visible are more likely to progress.

People who feel they belong are more likely to thrive.

Changing perceptions of who belongs

The podcast has welcomed guests from across engineering, infrastructure and the built environment, including former ICE President Professor Anusha Shah. Guests have included engineers, academics, project leaders, entrepreneurs and changemakers, each bringing unique perspectives and experiences.

Many discussions focus on topics rarely addressed in traditional technical forums.

How does someone build confidence early in their career?

What does leadership really look like?

How do people navigate challenges, setbacks and self-doubt?

What support mechanisms make the most difference?

These discussions matter because they reveal the human side of engineering.

Conversations also often go beyond professional milestones to explore the personal influences that have shaped their journeys, from their upbringing to their cultural backgrounds.

All in all, this helps to challenge outdated assumptions about who an engineer, leader or technical expert should look like.

What can AGS members do?

The good news is that meaningful change does not always require large budgets or complex programmes.

Often, it starts with simple actions.

AGS members can:

  • Share their career journeys more openly.
  • Support mentoring and sponsorship opportunities.
  • Engage with schools, colleges and universities.
  • Increase the visibility of diverse role models within their organisations.
  • Encourage early career professionals to speak, publish and present.
  • Create environments where people feel comfortable bringing their authentic selves to work.
  • Listen to the experiences of others and seek to understand different perspectives.

Most importantly, everyone can play a role in helping people feel that they belong.

Looking to the future

The future of ground engineering will undoubtedly be shaped by emerging technologies, changing regulations, sustainability challenges and new technical solutions.

But it will also be shaped by people.

By the students who have yet to discover geology.

By the graduates who are just starting their careers.

By the future leaders who may currently be questioning whether they belong.

As an industry, geotechnical and geoenvironmental specialists spend much of their time thinking about foundations.

Perhaps one of the most important foundations we can build is a profession where every talented individual can see a place for themselves.

Because when more people can see themselves in engineering, the profession becomes stronger, more innovative and better equipped to tackle the challenges ahead.

And sometimes, that journey begins with something as simple as a conversation over a cup of chai.

How to get involved

The hosts welcome connections with geotechnical and geoenvironmental professionals who are passionate about inspiring future talent, sharing their stories and helping create a more representative profession for the next generation. For AGS members interested in listening, all episodes of Chai & Chat Engineering are available on Spotify and Amazon Music.

Listen to the podcast:

Contact us:

chaichatengineering@gmail.com

LinkedIn:

Dipalee Jukes | LinkedIn

Era Shah CEng MICE | LinkedIn

Malika Kapasi | LinkedIn

By Dipalee Jukes, Era Shah and Malika Kapasi, Co-hosts of the Chai & Chat Engineering Podcast

Article Contaminated Land

Overview of pesticide use on agricultural land, and human health risk assessment

- by
Tags: Featured

Pesticide is a generic term for a substance used for preventing and controlling insects or other organisms harmful to cultivated plants or animals1. Within agriculture they can be split into three broad categories: herbicides, fungicides and insecticides.

They can exist in many forms, such as solid granules, powders or liquids, and consist of one or more active substances co-formulated with other materials.

Today there are approximately 1,300 approved pesticides within the UK1.  The majority of pesticides used on arable farmland are fungicides (such as tebuconazole) and herbicides (such as glyphosate)2.

Regulatory Regime

Pesticides have been around for a long time, for instance during the mid-18th Century inorganic substances such as arsenic and copper sulphate were used to prevent fungal diseases in wheat.  However, traditional methods of pest control such as crop rotation and tillage were prevalent until the development and commercialisation of synthetic insecticides (organochlorines and organophosphates) from the 1930s to 1950s3.

The environmental impacts of these substances were not known by the general public, but a notable decline of wildlife during the 1960s, and the publication of the infamous book ‘Silent Springs’ by Rachel Carson4, brought the potential detrimental impact of pesticides (namely Dichlorodiphenyltrichloroethane, commonly known as DDT) into the public eye and instigated the establishment of the Countryside Act 1981.  This act was not specifically related to pesticides, but prohibited methods of killing wild animals e.g. poisoning.

As the human and environmental risks became more apparent, further legalisation was passed.  The ‘Control of Pesticides Regulations’ (1986)5 introduced a registration system for pesticides as well as requiring appropriate labelling and training on their application.  In the UK, pesticides such as DDT were withdrawn from registration in 1984 by the Health and Safety Executive, followed by the  ‘drins’ ( Dieldrin, Aldrin, and Endrin) during the 1990s and therefore were no longer authorised for use in the UK.

The Stockholm Convention was adopted by the UK in 20016 (enacted in 2004), which sought to protect human health and the environment from persistent organic pollutants (POPs), which are resistant to environmental degradation, by reducing or eliminating harmful use of POPs.  This included aldrin, chlordane, DDT, dieldrin, heptachlor, mirex, toxaphene and PFAS (per- and polyfluoroalkyl substances).

Further regulation was introduced in 20081 (Pesticide Maximum Residual Levels Regulations, England and Wales) which was enacted to ensure compliance with the European Union pesticide residual limits on food, animal feed and animal origin to protect human health and environment.

In 2025, the UK government introduced the Pesticide National Action Plan7, which aims to reduce pesticide use by at least 10% by 2030.  The action plan proposes to do this by encouraging uptake of integrated pest management, setting targets for the reduction of the use of pesticides, and strengthening compliance.

Human health risk assessment.

Greater awareness of the environmental and health risks and increased regulatory oversight have increasingly prevented or limited the use of pesticides that are known to pose an environmental risk, although there is still some way to go.  For instance, there are currently over 30 pesticide products in the UK that contain PFAS, which are known to be persistent in the environment, and increasingly are being recognised as a risk to health, land and aquatic ecology.

Pesticides that are spread over wide tracts of agricultural land represent a diffuse source of contamination, and following breakdown in the environment, or removal by surface run-off  / leaching, the risk to human health reduces.  Organic pesticides naturally break down in the environment through volatilisation, photodegradation, and microbial degradation, with the latter most prominent.  The break-down process depends on a variety of factors such as the chemical composition of the pesticide and soil type.  The longevity of pesticide in the environment is measured by its half-life (the time it takes to reduce by half) and may be taken into consideration as part of a risk assessment.  Examples of pesticide half-lives in agricultural soils are presented in Table 1, below. However, in oxygen-depleted or waterlogged environments, the half-life can be significantly extended.

Table 1 Pesticide half-lives

Pesticide Group Topsoil half life
(aerobic & photolysis)10
Organochlorines 2 to 15 years
Organophosphates 1 to 3 months
Carbamates 10 days to 2 months
Pyrethroids 1 to 4 months
Triazines & triazoles 2 months to 4 months
Neonicotinoids 2 months to 5 months (longer in dry conditions)
Glyphosate Up to 1 week


The Pesticides Properties Database (PPDB) is a useful source of information developed by the Agriculture & Environment Research Unit (AERU)9 at the University of Hertfordshire. The database contains information on pesticide approvals, physio-chemical properties, environmental fate, human health and ecotoxicological data.   However, the database does not contain any generic assessment criteria.

An increased risk and therefore focus of any human health risk assessment should be on pesticides which can remain in the environment, such as POPs  (including PFAS), and where their usage could have been concentrated through intensive use, cleaning of equipment, and disposal, or where they can be trapped in anaerobic conditions (e.g. sediments and burial of wastes). Examples include sheep dips, greenhouses, orchards, former slurry pits and vehicle wash down areas. These features can often be identified on historical maps, however without knowledge from the previous landowners it can be very difficult to determine exactly which pesticides have been used. It may therefore be prudent to screen against a range of POPs and other historical pesticides that could have been used within a particular agricultural setting. Table 2 below sets out a list of widely used pesticides in agriculture (not exhaustive) and their uses.

Table 2 Widely used pesticides and their uses

Type Use
Organochlorines such as DDT, the ‘drins’ heptachlor, chlordane, endosulfan, dicofol and lindane. Used as insecticides since the 1940s – banned/withdrawn from use in the UK. Classified as POPs under the Stockholm Convention
Organophosphates such as Chlorpyrifos, Malathion, Diazinon, Parathion


Used as insecticides since the 1940s – banned/withdrawn from use, except for Malathion.
 

Pyrethroids

Insecticides used since the 1950s – not banned, but used as a last resort.
 

2,4-Dichlorophenoxyacetic acid


Herbicide – used since the 1940s, still approved for use within the UK.
Triazine pesticides such as atrazine, simazine, and propazine Herbicide used since the 1950s.  Atrazine was withdrawn from use in 2004.
Glyphosate Herbicide used since the 1970s – still commonly used today. Classified as a possible carcinogen with reproductive/developmental effects on human health.
Tebuconazole Fungicide used since the 1970s – still commonly used today.  Classified as moderately persistent with highly hazardous properties*
Note:  Pesticides highlighted in bold are classified as POPs by the Stokholm Convention.

* Agriculture & Environment Research Unit


To quantify risk where pesticides are encountered, generic human health assessment criteria (Suitable for Use Levels (S4ULs)), has been published in the UK by Land Quality Management and the Chartered Institute of Environmental Health for nine pesticides8.  These are, Aldrin, Dieldrin, Atrazine, α-Endosulfan, β-Endosulfan, α-Hexachlorocyclohexane, β-Hexachlorocyclohexane and Lindane (y-Hexachlorocyclohexane).   Assessment criteria for other pesticides can be found on the US Environmental Protection Agency website, but should be used with caution given the differences in the UK and US approaches to risk assessment.

Conclusions

There has been a long history of pesticide use within the UK, which really intensified from the 1940s onwards along with agricultural practices.  The risk to human health and the environment was overlooked or poorly understood until decades later when legislation and registration were enacted, and some of the harmful pesticides such as DDT were banned.  Legislation and research on toxicology and environmental fate still struggle to keep up with chemical use in agriculture, and there remain numerous pesticides in use that will potentially lead to an ongoing legacy of contamination, such as the continued use of PFAS.  However, awareness of these issues is increasing, and efforts are being made to limit pesticide use.

In relation to the risks to human health, the greatest risks are from the more persistent pesticides that can remain in the environment for long periods of time, and where their use was concentrated.  These should be the focus of any risk assessment.

Only a limited number of generic assessment criteria for human health risk assessment have been derived to date for pesticides. The UK contaminated land industry would certainly benefit from the publication of some additional criteria as well as specific guidance on the assessment of pesticides if someone would be prepared to take on the challenge.

References

1 Health and Safety Executive, 2026, ‘Pesticides’, (www.hse.gov.uk/pesticides/).

2 Fera, December 2024, Pesticide Usage Survey Report (https://pusstats.fera.co.uk/published-reports).

3 Pollenzie, May 2022, ‘The History of Pesticide Use in the UK: A Pollenize Perspective’, (https://www.pollenize.org.uk/the-buzz-blog/the-history-of-pesticide-use-in-the-uk-a-pollenize-perspective).

4 Carson, R, 2002, ‘Silent Spring, Penguin Classics.

5 Control of pesticide Regulations (1986), (https://www.legislation.gov.uk/uksi/1986/1510/made).

6 Secretariat of the Stockholm Convention, 2026, ‘Stockholm Convention on Persistent Organic Pollutants (POPs)’, (https://chm.pops.int/TheConvention/Overview/tabid/3351/Default.aspx)

7 Gov UK, 2025,’ UK Pesticides National Action Plan’ ( https://www.gov.uk/government/publications/uk-pesticides-national-action-plan-2025)

8 LQM/CIEH, 2015, ‘Suitable 4 Use Levels’.

9 University of Hertfordshire, 2026, ‘Pesticides Database’ ,https://sitem.herts.ac.uk/aeru/bpdb

10 Dhakal, G., Thapa Magar, S., & Fujino, T. (2025). Pesticide Degradation by Soil Bacteria: Mechanisms, Bioremediation Strategies, and Implications for Sustainable Agriculture. Environments, 12(12), 492. https://doi.org/10.3390/environments12120492

Article by Andrew Tranter, Senior Principal Geoenvironmental Consultant at Stantec UK


Article Safety

Hazard Observations: Strengthening Safety Through Awareness and Action

- by
Tags: Featured

Introduction

Learning more about the situations which harm workers, through planned formal and informal hazard observation, can play a critical role in reducing and preventing workplace injuries and safeguarding lives.

Workplace incidents rarely occur without some kind of pre-warning, although these are often missed, misinterpreted or even just not considered as of importance or relevance. They are often the result of unsafe conditions, unsafe acts or omissions, hazardous and often changing environments, human behaviours and factors, or overlooked hazards. Effective hazard observation interrupts this progression and can enable timely intervention before harm occurs.

The Value of Hazard Observations at Every Level

All hazard observations are important, regardless of whether they are proactive, reactive, or related to a near miss and each observation contributes to a broader understanding of workplace risk.

Historical research has long shown that serious injuries and fatalities are often preceded by a much larger number of minor incidents and near misses. Tackling these early warning signs is one of the most effective ways to prevent more severe outcomes.

For this reason, reporting and acting on hazard observations should be strongly encouraged. A situation that resulted in a favourable outcome today may not do so next time, especially if the factors that prevented injury or loss are no longer present.

It is worth noting that some research suggests an over‑emphasis on minor observations can create a false sense of security, leading organisations to believe that low‑frequency, high‑severity incidents are less likely than they actually are. This makes it especially important to be organised and to ensure that hazard observations are of high quality and genuinely meaningful. (https://onepetro.org/SPEHSE/proceedings-abstract/10HSE/10HSE/SPE-126661-MS/106407)

Common Hazards and the Consequences of Unresolved Issues

The HSE has grouped together the most common causes of serious injury at work, such as slips and trips or working at height (see table below, taken from https://www.hse.gov.uk/simple-health-safety/risk/common-workplace-risks.htm#contentContainer), many of which are particularly relevant to the ground engineering industry (see bold text).  Note that the bold text are regularly the causes of the most frequent significant accidents in the UK workplace based on accident statistics previously issued:

Asbestos Confined spaces Display screen equipment Electrical safety Equipment and machinery Fire safety
Gas safety Harmful substances Manual handling Noise Personal protective equipment Pressure equipment
Radiation Slips and trips Vibration Working at height Workplace transport Work-related stress


H&S practitioners sometimes identify accidents/incidents arising from two sources (https://www.hse.gov.uk/humanfactors/assets/docs/core2.pdf):

  • Active failures: immediate actions or errors made by frontline staff, with consequences that appear straight away and can often be prevented through better design, training, or systems.
  • Latent conditions: “hidden” weaknesses within organisational culture and behaviours, management practices and arrangements, or system design. These may present themselves as:
o   Poorly designed plant or equipment o   Weak communication
o   Ineffective training o   Lack of necessary resources
o   Insufficient supervision o   Unclear roles or responsibilities


Underlying “latent” issues may go unnoticed until they combine in unexpected ways and contribute to human error or rule‑breaking. As everyone is capable of making mistakes, identifying and addressing both active and latent factors is essential for preventing incidents.

Immediate Causes and Contributing Factors

Below are common examples of immediate causes of accidents and their contributing factors:

Job‑related factors

  • Poorly designed equipment or instruments
  • Frequent interruptions or distractions
  • Missing, unclear, or confusing instructions
  • Equipment that is not properly maintained
  • Excessive workload
  • Noisy, uncomfortable, or unpleasant working conditions

Individual factors

  • Low skill levels or insufficient competence
  • Fatigue, boredom, or low morale
  • Complacency
  • Risk-taking behaviour or cutting corners
  • Personal or medical issues affecting performance

Organisational and management factors

  • Inadequate work planning that creates high pressure
  • Lack of effective safety systems or protective barriers
  • Poor follow‑up or weak responses to previous incidents
  • One‑way communication from management
  • Unclear responsibilities or poor coordination
  • Weak health and safety management
  • A poor overall safety culture

Understanding both the immediate and underlying causes of an accident or near miss is essential for preventing similar events and establishing effective controls. This is the core purpose of any incident investigation.

Equally important, however, is the practice of identifying and reporting hazards before they lead to an incident. Proactive hazard observation plays a critical role in stopping unsafe conditions from escalating into actual harm. Hazard observation is a skill that improves with deliberate practice, particularly through regular field-based observation where risks are most visible and best understood.

Hazard Observations in Practice

Observations or hazards in practice can be undertaken in several ways, including:

  • Planned and structured observations, such as routine inspections and formal safety checks, but also supplemented by informal (albeit structured) observations by staff.
  • Day-to-day observations, where individuals take a moment to assess what they are being asked to do and identify potential risks before commencing work.

However, hazard observations are far more effective when they involve direct discussion with workers or colleagues about the task at hand. This is distinct from a pre‑task briefing and can be especially powerful for several reasons:

  • Workers can explain the real‑world challenges they face while carrying out the task
  • They often offer practical, experience‑based suggestions for completing the work more safely or efficiently
  • These conversations support the legal duty to consult workers when developing safe systems of work
  • Informal, face‑to‑face engagement demonstrates genuine interest from supervisors, managers, and leaders in workers’ wellbeing and perspectives, reinforcing that their insights can help improve safety for everyone

Reporting Systems and Organisational Processes

When carried out with the aim of understanding real hazards and the effectiveness of existing controls, a hazard observation can be formally recorded in a management system or similar platform. This creates valuable evidence of worker engagement and compliance, and it contributes to broader organisational learning and improved safety practice.

Employers and organisations benefit greatly from maintaining an accessible and straightforward hazard observation reporting process, which can be further enhanced through tools such as smartphone applications. Keeping these records provides valuable insight into the real risks workers encounter in the field and enables the organisation to take meaningful action to address them.

Demonstrating consistent care for workers in this way, and being visibly committed to it as standard practice, creates a safer, more trusting environment for everyone.

However, it is essential that hazard observations are not perceived by workers as attempts to “check up on” or “catch out” individuals. Without clear and genuine intentions, and without workers believing those intentions, that is exactly how such activities can be interpreted. This can seriously undermine trust between workers and employers and, in turn, weaken the overall quality of health and safety on a project.

Observers must therefore recognise this risk and plan their approach carefully: how they conduct the observation, how they hold the discussion, and how they record the findings all matter. Many organisations choose not to formally report these interactions for this very reason, while others deliberately omit names or specific work locations.

The primary aim should always be organisational learning, not policing compliance.

A clear and well-communicated process can contribute to:

  • Workers having a voice in how the work is carried out
  • Observations being reviewed, investigated, and acted upon
  • Emerging trends and recurring issues being identified
  • Reduced risk while worker engagement and productivity can be enhanced

How to Observe during a Hazard Observation

Good hazard observation starts with planning, including:

  • Knowing what physical works and tasks are expected to be taking place
  • Understanding which equipment and personnel should be involved
  • Being aware of the controls that are expected to be in place to manage the pre‑identified hazards

Looking at the risk assessment and method statement beforehand is useful and important.

On approaching the site/workplace, observe from a safe place and at a distance so you can see the wider aspects of the work being carried out. This will help you to understand:

  • Whether there are others doing different tasks close by
  • Whether the work environment looks as it was envisaged in the RA/MS,
  • Whether there are different environmental conditions potentially affecting the way we are working (weather, groundwater, livestock etc.)

This will then allow you to:

  • Take time to observe the people, equipment, and work methods in use. Be methodical: work through each task, identify the associated hazards, and compare the controls in place with what you expected from your pre‑planning.
  • Consider whether the situation matches those expectations and whether the planned controls are genuinely effective in keeping workers safe. The aim is not to find non‑compliance, but to identify where controls may be insufficient.
  • Make notes for your own reference and for communicating findings later. Keep the details factual, specific to the task, and grounded in what you observed. This level of detail is far more valuable than broad or generic statements.

Ensure you speak with the worker at a time that is safe and convenient for them. During the conversation:

  • Explain who you are and the purpose of your visit or observation
  • Ask how the task is going, what has changed, what is proving difficult, and whether they have suggestions for making this task—or similar tasks—safer or more efficient
  • Ask what hazards they have encountered, including any that were unexpected
  • Check whether the controls in place are effective and practical, such as whether PPE is suitable and comfortable
  • Avoid arguing or justifying; focus on listening. Be human, show genuine care for them and for colleagues doing similar work
  • Invite them to share any additional information, concerns, or ideas they may have
  • Thank them for their time and for pausing their work to support yours. Encourage them to contact you if they have further ideas, and provide your contact details
  • If, and only if, the task being carried out is unsafe (for example, if there is serious and imminent danger to health and safety), stop the task, explain why, and involve the appropriate project personnel to make the situation safe

Do not use a hazard observation exercise as an opportunity to enforce minor safety infringements. This time should be focused on learning from the task, from the environment, and especially from the workers themselves.

How to Record and Report a Hazard Observation

If it is agreed with the Employer that hazard observations will be documented, recording and reporting should follow a straightforward, preferably structured and repeatable process that captures all useful details, preferably linking to the Employer’s/contractor’s H&S information system. It might just involve a digital form, a smartphone application, or filling out a paper record.

Each observation should:

  • Include the date, time and location and describe the task and your observations, along with relevant environmental conditions.
  • Include photographs or videos to help provide clarity. Ensure these are permitted and agreed with the worker.
  • Keep the information factual, specific, and focused on behaviours, equipment and environmental factors.
  • Consider what the impact or consequence might be if the potential hazard is left unaddressed, particularly where a different or new hazard has been observed (eg. a change in environmental conditions, weaker or uneven ground, a different piece of equipment being used which may have not been allowed for or are significantly different from the RA/MS).
  • Be based on discussions with the worker and your own considerations, and include a suggested practicable control method where possible, even if it is only a temporary measure.

Fig 1. Photo of Kevin Puckett, Health & Safety Manager. Taken by Rachael Parry.

It should be understood if escalation (including immediate) is necessary due to what you have observed or learned.

Hazard observation is not well suited in the event of an incident or near miss and certainly not immediately following one. In those cases, the incident must be reported and investigated in accordance with employer/site procedures, including immediately to the Site Manager or similar.

Recognising Positive Safety Behaviours

Hazard observation systems can also be an effective way to recognise and reinforce positive behaviours. Submitting positive observations allows organisations to acknowledge individuals who show outstanding commitment to health, safety, and wellbeing. In some workplaces, this recognition is further supported through formal health and safety awards or commendations and can help to strengthen overall culture and boost morale.

Creating a Culture of Accountability and Care

Documenting hazards is not about assigning blame or identifying fault. It is about protecting people, learning from experience, and reinforcing a shared commitment to safety. When individuals are encouraged and supported to raise concerns without fear, safety becomes proactive rather than reactive.

A strong safety culture is built on shared responsibility. When everyone takes ownership of safety, trust grows, engagement improves, and people naturally look out for one another. For this to happen, managers and leaders must consistently demonstrate their commitment to workers’ safety. Workers need to see and believe that their wellbeing genuinely matters.

When carried out with the intent to learn and improve, hazard observation can play a significant role in reinforcing this commitment and strengthening the overall safety culture.

Driving Continuous Improvement

Hazard observations can support the ongoing development and refinement of safe systems of work. They enable organisations to:

  • Recognise positive behaviours and good practices
  • Verify compliance with Health and Safety Procedures
  • Improve Risk Assessments and Method Statements (RAMS)
  • Strengthen Standard Operating Procedures (SOPs)

Safety is not simply a compliance exercise, it is a mindset. Each observation represents an opportunity to learn, adapt, and improve.

Article provided by Rachael Parry, Operations Support Manager at Geotechnical Engineering Limited