For an increasing number of sites, previous site investigation data can provide information on the ground conditions, potential contamination and liability. In addition to considering how a site has changed and how the contamination may have moved (e.g. through leaching) or transformed (e.g. by biodegradation), it is essential to understand the limitations of the original data itself. This article considers the changes in practices for soil chemical data in particular laboratory analysis, as shown in Figure 1.
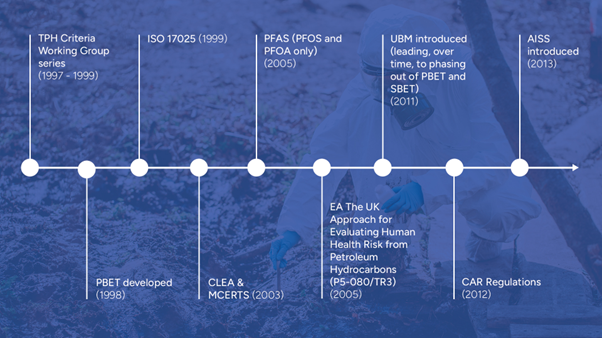
Figure 1 A timeline of key developments relating to lab analysis and risk assessment
Laboratory Quality Standards
Before 2003, ISO/IEC 17025 (introduced in 1999, replacing ISO Guide 25) required laboratories to follow a written methodology for testing and calibration (typically based on British or international standards). There was no UK performance standard for soil analysis. While Proficiency Testing (PT) schemes, such as CONTEST, were in place for the interlaboratory comparison of soil data, not all laboratories participated. There was thus no clear way to determine the quality of laboratory results. In 2003, the Environment Agency’s (EA) Monitoring Certification Scheme (MCERTS) was introduced. MCERTS builds on ISO/IEC 17025 by establishing additional technical requirements that laboratories are required to meet.
This was a significant change that encouraged laboratories to establish performance characteristics over the next few years to ensure analytical procedures were suitable for use, but it should be noted, does not guarantee consistency between different laboratories. MCERTS is applicable where laboratory results are generated and submitted to the EA for regulatory purposes. MCERTS was developed and implemented by the Environment Agency, in collaboration with the United Kingdom Accreditation Service (UKAS), to deliver quality environmental measurements.
Soil Sampling and Preparation
BS 10176
Sampling methods for soil bulk testing have been broadly unchanged. However, one material change relates to losses of Volatile Organic Compounds (VOCs) from soils during sampling. It is now recognised that the conventional bulk sampling method can result in 90% to 99% loss of VOCs prior to laboratory analysis (Nathanail 2021). While VOC losses through volatilisation and biodegradation have been known to occur for a long time, adoption of processes to improve sampling, as detailed in BS 10176, has only recently been introduced to the UK.
Sample preparation at the lab
A key reason for a difference between laboratories is sample preparation. For instance, some laboratories sieve and remove material above 2mm, some remove material above 10mm, and some crush the whole sample. Analysing materials of different sizes can affect the results. This remains a source of uncertainty when comparing results. Previous AGS magazine articles (On Stoney Ground Re-Visited 2020) have highlighted the need to thoroughly review the procedures for preparation and extraction when comparing data from two laboratories.
The Analysis Procedures that are Broadly Unchanged
Concerning the analytical methods themselves, analysis for inorganics has not changed significantly:
- Metals were in the past generally analysed by Inductively Coupled Plasma (ICP) coupled with optical emission spectroscopy, mass spectrometry or by atomic fluorescence
- Colourimetry was used for hexavalent chromium, ammonium and cyanide
- Electrochemical probes used for pH
Recently, laboratories are moving towards using ion chromatography (IC) methods to determine hexavalent chromium. The use of IC provides better detection limits and the method is less susceptible to interference.
For organics, analytical techniques for some substances have not changed substantially since the early 2000s. This applies to VOCs and Semi-Volatile Organic Compounds (SVOC) using Gas Chromatography with Mass Spectrometry (GC-MS). The 16 speciated Polycyclic Aromatic Hydrocarbons (PAHs) were carried out using GC-MS or Gas Chromatography with Flame Ionisation Detection (GC-FID). The latter has fallen out of favour as it struggles to distinguish between benzo(b)fluoranthene and benzo(k)fluoranthene. Such data should be treated with caution given the limitations of GC-FID analysis for specific PAHs.
Analysis that has been Phased Out
Solvent extractable material
In the late 1990s and early 2000s, only crude screening methods for organics were used. These methods were initially named after the solvent (e.g. Toluene extractable material (TEM)) but as toluene was phased out laboratories used a solvent mixture to mimic the polarity of toluene, and the test became known as solvent extractable material (SEM). This analysis would include heavier organics that are typically found in the SVOCs and TPH suites. Their lack of specificity makes interpretation of the results extremely difficult. Some refinements to this analysis involved the use of thin layer chromatography (TLC) combined with an FID to split the solvent extract into three fractions: non-polar (mineral oil), semi-polar (aromatics) and polar organics (heteronuclear nitrogen, sulphur and oxygen-containing organics (NSO) and resins including asphaltenes).
Total PCBs
Early total methods for analysis of Polychlorinated Biphenyls (PCBs) were non-selective. Although the techniques used have not changed significantly, there has been a change in what is measured and reported, for example, the concentration of specific “Arochlor” mixtures. Here, Arochlor refers to a common trade name for PCBs. PCB mixtures were named according to their chlorine content, Arochlor 1254 containing 54% chlorine by weight, and Arochlor 1260 containing 60%.
Laboratories moved towards measuring individual PCB compounds (or “congeners”) including suites of dioxin-like PCBs (World Health Organisation 12 PCBs) typically used in Human Health Risk Assessment. It should be noted these PCBs are not the most commonly occurring and only account for approximately less than 4% of the congeners produced. The PCB 7 suite originated from the list of PCBs by the International Council for the Exploration of the Sea (ICES). It later became a requirement for Waste Acceptance Criteria testing and therefore widely adopted by all labs. These 7 PCBs also only make up approximately 20% by weight of commercial mixtures. More recently, High Resolution Mass Spectrometry (HRMS) methods allow for lower detection limits in comparison to GC-MS and are able to better resolve PCBs that are structurally similar.
Analysis with Significant Changes
Asbestos
Prior to the introduction of the Control of Asbestos Regulations (CAR) in 2012, analysis of asbestos in soil was conducted as a visual screen. In particular, screens for asbestos were focused on identifying bulk asbestos within the soil, rather than small fragments and free fibres. The analysis was thus not very sensitive. Between 2012 and 2014, UKAS was to require laboratories to move towards a more sensitive method to include looking for loose fibres using microscopy and for even smaller fibres using Phase Contrast Optical Microscopy (PCOM). It is not uncommon for soil screened for asbestos before 2012 to now be shown to contain asbestos. Participation in PT schemes such as Asbestos in Soils Scheme (AISS), Asbestos in Materials Scheme (AIMS) and RICE (fibre counting) allows laboratories to monitor and improve the quality of their measurement results in terms of accuracy and comparability.
Total Petroleum Hydrocarbons (TPH)
The analysis for TPH has changed over time. In 1998, in the US, the TPH Criteria Working Group (TPH CWG) developed a method for separating hydrocarbons into aromatic and aliphatic fractions, and then subdividing these into carbon bands. This TPH CWG approach was then modified for the UK (EA, 2005) and extended to consider the work of the American Petroleum Institute (API) on heavier hydrocarbon fractions. The intention has been to ensure standardisation when assessing TPH risk in UK soils.
Until recently, TPH analysis was carried out using GC-FID. This analysis provided:
- Light hydrocarbons (sometimes called petrol or gasoline range organics (PRO or GRO) or Volatile Petroleum Hydrocarbons (VPH)). The carbon range varied but was typically C5-C12 or C5-C10 and included benzene, toluene, xylene and ethyl benzene (BTEX).
- Hydrocarbons in the semi-volatile organic range variously referred to as EPH Extractable Petroleum Hydrocarbons (EPH) or Diesel Range Organics (DRO). Again, the carbon range varied but may start as low as C8 or C10 and rise to C44.
The removal of indigenous non-hydrocarbon polar organic compounds (such as humic acids) commonly found in soils involves the use of clean-up techniques. These compounds are retained on the column and not eluted with the aliphatic or aromatic component fractions. This ensured a broadly similar procedure for clean-up between most of the laboratories.
More recently, laboratories have looked toward using Comprehensive two-dimensional gas chromatography (GCxGC-FID) for analysis of TPH. GCxGC analysis employs two chromatography columns with different separation mechanisms. The conventional boiling point separation is maintained in the first dimension while aliphatics and aromatics are separated in the second dimension in a single run. Using GCxGC-FID, classes of hydrocarbons are ordered in well-defined bands. Biogenic compounds elute in a specific area of the chromatogram. Laboratories have each developed methods to “clean-up” the sample using software to exclude this area from the reported TPH results. This can lead to variation and inconsistency particularly where labs are not carrying out any form of clean-up.
Oral Bioaccessibility of Metals
Methods to assess the proportion of metals available for absorption into the body following ingestion are known as a metal’s oral Bioaccessibility. A Physiological Based Extraction Test (PBET) was first developed in 1998 by the British Geological Survey (BGS), which involved simulating the leaching of a solid matrix in the stomach and small intestine. For lead, it was found that only the stomach phase extraction was required to assess oral bioaccessibility and the Simplified Bioaccessibility Extraction Test (SBET) was developed with this single stage.
With the introduction of the Contaminated Land Exposure Model (CLEA) model in 2003, these methods became a popular way to further assess the risks from metals (particularly lead and arsenic) for those carrying out detailed quantitative risk assessments. In 2011, a pan-European group, the “Bioaccessibility Research Group of Europe “ (BARGE), carried out an inter-laboratory trial of a proposed harmonised in vitro physiologically based ingestion bioaccessibility procedure for soils, called the Unified BARGE Method (UBM). The UBM method now includes an initial saliva phase and simulated stomach and intestine compartments. BS ISO 17924 is based on the UBM method. It has in-vivo validation for arsenic, cadmium and lead. More recent methods (BS ISO 8259) have been developed or are currently in the drafting stages (BS ISO 7303).
There are several tests available that have been developed for soil ingestion to estimate bioaccessibility. Preference in selection should be given to those that have in-vivo validation data for specific contaminants of concern.
Emerging Contaminants
Per- and polyfluoroalkyl substances (PFAS) have been the focus of much attention in recent years. However, analysis of these substances in the UK was not commonplace until after the Buncefield fire in 2005. Testing initially focused on perfluorooctane sulfonic acid (PFOS) and perfluorooctanoic acid (PFOA) before more extensive suites were established over time. PFAS might have been present on many sites previously investigated but analysis was either not carried out or only a limited PFAS analytical suite will have been used.
Conventional PFAS analysis is carried out using liquid chromatography coupled with tandem mass spectrometry (LC-MS/MS). Only a relatively small fraction of known PFAS can been measured via targeted chemical analysis and many more PFAS are likely to occur in the environment than are routinely analysed. Nor does this approach account for precursors that can transform over time to more regulated perfluoroalkyl acids (PFAAs). Non-target methods such as Total Oxidisable Precursor Assay (TOP Assay), Combustion Ion Chromatography (CIC) and High Resolution Mass Spectrometry (HRMS) can assist in understanding the fluorine mass balance (to determine whether targeted methods account for the mass of PFAS).
Summary
As knowledge has improved about exposure and toxicological of contaminants so have testing methods needed to evolve. Technological advancements have led to lower detection limits, increased suites of analytes and use of automation as well as analysis of more complex matrices. Interpretation of historic lab analysis requires careful review and understanding of the limitations of previous methods and practices. Even current suites will require addition site-specific testing should failures be observed or identified during due diligence.
References
ISO/CD 7303, Simplified method for oral bioaccessibility of metal(loid)s in soils
BS ISO 8529, Soil quality – Bioaccessibility of organic and inorganic pollutants from contaminated soil and soil-like material
BS EN ISO/IEC 17025, General requirements for the competence of testing and calibration laboratories
BS ISO 17924, Soil quality – Assessment of human exposure from ingestion of soil and soil material – Procedure for the estimation of the human bioaccessibility/bioavailability of metals in soil
BS 10176, Taking soil samples for determination of volatile organic compounds (VOCs) – Specification
ENVIRONMENT AGENCY. The UK approach for evaluating human health risks from petroleum hydrocarbons in soils. Science Report – P5-080/TR3. Bristol: Environment Agency, 2005
ENVIRONMENT AGENCY. Performance standard for laboratories undertaking chemical testing of soil. Bristol: Environment Agency, 2023
ENVIRONMENT AGENCY. Performance standard for organisations undertaking sampling and chemical testing of water. Bristol: Environment Agency, 2024
NATHANAIL P. Taking Soil Samples for the Determination of Volatile Organic Compounds. AGS Magazine 2021
PLIMMER, M. On Stoney Ground Re-Visited. AGS Magazine 2020
Total Petroleum Hydrocarbons Criteria Working Group (TPHCWG) Series: Volume 1: Analysis of Petroleum Hydrocarbons in Environmental Media (TPHCWG, 1998a) Amherst, MA: Amherst Scientific Publishers.
WRAGG, J., CAVE, M., TAYLOR, H., BASTA, N., BRANDON, E., CASTEEL, S.,
GRON, C., OOMEN, A., REIMER, K., TACK, K. and VAN DE WIELE, T. An inter- laboratory trial of the unified BARGE bioaccessibility method for arsenic, cadmium and lead in soil. Science of the Total Environment, 2011; 409 (19): 4016–4030.
Article provided by Barry Mitcheson, WSP and Geraint Williams, HKA Global