 Search
Introduction
Deciding whether to remediate or to stop remediating land contamination is routinely made on the basis of laboratory results that appear precise and accurate: concentrations below an assessment criterion may be treated as acceptable and above it as unacceptable. Yet that apparent granularity can conceal important limitations. This becomes particularly important when the criterion is very close to the lowest concentration the laboratory can detect.
A result reported as <0.01 mg/kg does not indicate the absence of a substance. Equally, a result of 10.2 mg/kg does not mean that the true concentration is known exactly to three significant figures. Every reported concentration has limitations arising from detection capability, method performance and measurement uncertainty. Before the sample reaches the laboratory, uncertainty is introduced by site heterogeneity, sampling, handling and sub-sampling – topics for another day.
An analytical result is therefore not simply a number. It is an estimate produced by a measurement process that represents a number with a specified degree of confidence. The key question for the risk assessor is not only “What result did the laboratory report?” but “What does this result actually allow me to conclude?”
What does “not detected” actually mean?
A result reported as <0.01 mg/kg does not establish that the analyte concentration is zero. Indeed no chemical analysis can report that a substance is completely absent – leaving aside the philosophical reality that “zero” is not a number. “Not detected” means that the analyte cannot be reported quantitatively above a defined analytical threshold, which may be described as a detection limit, quantification limit or reporting limit depending on the method and laboratory. These terms are related, but are not interchangeable.
Laboratory analysis depends on the equipment responding to the presence of a substance – the higher the concentration of that substance the stronger the response. At low concentrations, an analytical response becomes progressively more difficult to distinguish from variation caused by instrument noise, blanks, extraction, matrix interference and other components of the measurement process (Analytical Methods Committee, 1987; Cantwell, 2025). The limit of detection (LOD) is therefore better understood as a measure of detection capability under defined analytical conditions rather than simply “the lowest concentration the instrument can resolve”.
Instrumental sensitivity is only one part of a method. Performance must also reflect extraction, clean-up, identification, quantification and reflects the effects of the environmental matrix.
The Environment Agency’s Monitoring Certification Scheme (MCERTS ) provides a recognised framework for demonstrating that environmental monitoring equipment, personnel and laboratory activities meet defined quality and performance standards. It requires laboratories to demonstrate a method’s suitability for the analyte(s), relevant matrix and intended application (Environment Agency, 2021, 2023).
Detection or (reliable) quantification
The limit of quantification (LOQ) represents the lower concentration at which a result can be quantified with acceptable performance for its intended purpose. Below the LOD, the method cannot reliably distinguish the presence of an analyte from analytical background. Between the LOD and LOQ, there may be evidence that the analyte is present, but quantitative confidence is reduced. Above the LOQ, the concentration of the analyte can be quantified within the established performance of the method (Analytical Methods Committee, 1987; Cantwell, 2025).
Environmental laboratory certificates of analysis may use a further term: the reporting limit. This may equal or be higher than the LOQ. A laboratory may use a reporting limit above instrumental detection capability because it reflects the concentration at which the complete method can routinely provide reliable results. For example, an LOD of 0.001 mg/kg, an LOQ of 0.003 mg/kg and a routine reporting limit of 0.01 mg/kg are perfectly compatible.
A problem arises when <0.01 mg/kg is treated as zero. The true concentration could be 0.002, 0.005 or 0.009 mg/kg. The laboratory has not resolved the concentration below that threshold. Treating low-level observations as though nothing has been measured can also distort subsequent interpretation (Analytical Methods Committee, 2001, 2020).
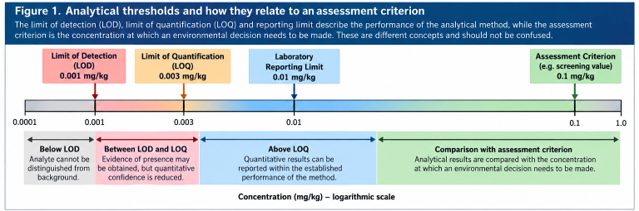
Figure 1. Analytical thresholds and how they relate to an assessment criterion.
The assessment criterion must be considered before analysis
Suppose the relevant soil assessment criterion is 0.005 mg/kg but the selected laboratory method has a reporting limit of 0.01 mg/kg. A result of <0.01 mg/kg cannot demonstrate compliance with the 0.005 mg/kg criterion because the actual concentration could still exceed the criterion: the method has failed to demonstrate that the concentration is below the criterion.
The analytical method should therefore be selected in relation to the concentration at which the environmental decision must be made. The useful question is not simply “Can the laboratory analyse PFOA or benzene?” It is “Can the laboratory measure this substance reliably at a concentration sufficiently low to support the decision I need to make?” Ideally, that question is answered before samples are collected (Environment Agency, 2021, 2023). Some risk assessors prefer a reporting limit no more than 10% of the assessment criterion – albeit this is not always possible for all analytes in all media.
A detected concentration is still not exact
Once a numerical concentration is reported, measurement uncertainty becomes important. A result such as 11.3 mg/kg should not be interpreted as though the true concentration is exactly 11.3 mg/kg. Uncertainty can arise from homogenisation and sub-sampling, weighing, extraction and recovery, calibration, reference materials, instrument repeatability, matrix effects, blank correction, analyst variation and data processing (JCGM, 2008; Ellison and Williams, 2012).
| Sources of Uncertainty in Laboratory Analysis | |
| Homogenisation | The process of mixing a sample until its contents are uniform; evenly distributed;the same throughout |
| Sub-sampling | The process of taking a small amount of material out of the sample container to use for analysis |
| Weighing | The mass of the material to be analysed, including whether it has been naturally or artificially desiccated |
| Extraction | Using a solvent or heat to remove the analyte from the rest of the matrix
|
| Recovery | How much of a substance is extracted from the matrix |
| Calibration | Checking the accuracy of an instrument against a known benchmark |
| Reference materials | Materials similar to the matrix or extract being analysed whose contents are known |
| Instrument repeatability | Producing closely matching results when measuring the same substance multiple times under identical conditions. |
| Matrix effects | The influence of other components in the sample on the measured response of the target analyte |
| Blank correction | Allowing for the measured concentrations in what should be a sample known to contain none of the substance |
| Analyst variation | The effects of different people carrying out the analysis |
| Data processing | The conversion of equipment generated data into the values reported in the certificates of analysis |
Table 1 Some sources of uncertainty in laboratory analysis
Relative uncertainty often becomes more important toward the lower end of a method because blanks, background variation, recovery and instrumental noise become larger in relation to the amount of analyte present. Detection capability asks whether the analyte can be distinguished from background; measurement uncertainty asks how much confidence can be placed in the quantitative result. They are different concepts, but they increasingly interact at low concentrations.
What happens close to an assessment criterion?
Measurement uncertainty is not a mathematical adjustment factor to be applied according to the preferred outcome. Where a formal statement of conformity is required, the way uncertainty is incorporated should be defined by an appropriate decision rule (ISO/IEC, 2017; ILAC, 2019).
Consider an assessment criterion of 10 mg/kg and results of 9.5 ±2.0 mg/kg and 10.5 ±2.0 mg/kg. The measured values fall either side of the criterion, but both uncertainty intervals overlap it. It is not scientifically defensible simply to subtract uncertainty from the higher result and call it a pass, or add uncertainty to the lower result and call it a failure. It is also not defensible to treat the assessment criterion as either an integer or as an “exact” number.
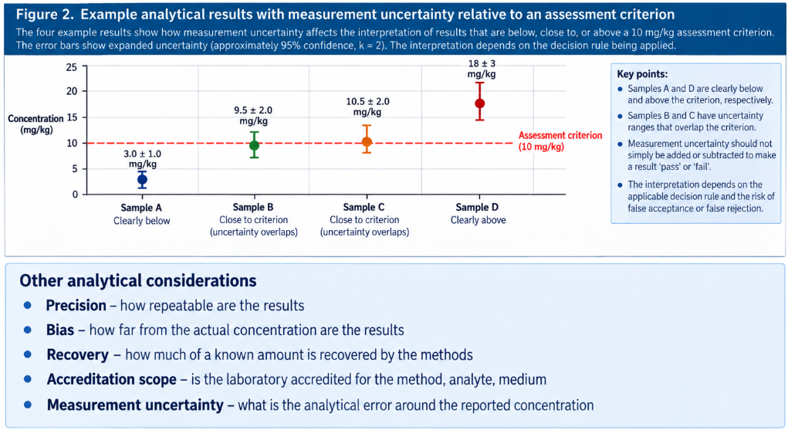
Figure 2. Example analytical results with measurement uncertainty relative to a 10 mg/kg assessment criterion.
Decision rules and guard bands
Conformity, or compliance, means that a measured result meets the specified requirement or acceptance criterion when the applicable decision rule and measurement uncertainty are taken into account. In this case it means the concentration being below the assessment criterion.
ISO/IEC 17025 defines a decision rule as how measurement uncertainty is accounted for when stating conformity. Where a laboratory reports “complies”, “does not comply” or “pass/fail”, it must document the rule and consider decision risk unless the rule is inherent in the specification (ISO/IEC, 2017; ILAC, 2019).
In contaminated-land work, the laboratory often reports the concentration while the consultant interprets it within a risk-assessment framework. The laboratory conformity decision and the environmental risk decision are therefore not the same thing. However, the underlying question remains: how will uncertainty be treated when the measured concentration is close to the decision threshold?
A guard band moves the acceptance boundary away from the specification limit so uncertainty is considered. It can reduce false acceptance but increase false rejection. No rule is universally correct; the approach depends on legislation, regulatory guidance, decision consequences and assessment purpose (ILAC, 2019; JCGM, 2012). It also needs to reflect the nature of the assessment criterion. Most generic assessment criteria including the Suitable for Use Levels (Nathanail et al 2015) are concentrations which if not exceeded represent minimal or no appreciable risk to human health. Some are based on such over cautious dose-response relationships that concentrations exceeding them require careful consideration.
Why can reporting limits vary between samples?
Different reporting limits within one laboratory report do not necessarily indicate inconsistency. Environmental samples can be analytically difficult. High concentrations of petroleum hydrocarbons or other matrix components may require dilution or additional clean-up to separate them from other confounding substances. A ten-fold dilution to ensure the analytical equipment can safely receive the sample can result in a ten-fold increase in the effective reporting limit. Other causes include limited sample mass, high moisture content, matrix suppression or enhancement, co-eluting compounds, poor recovery or elevated blank contamination.
Practitioners should therefore look beyond the concentration column. Qualifiers, dilution factors, accreditation status, dry-weight corrections, laboratory comments and reporting limits may materially affect interpretation (Environment Agency, 2023).
“Non-detect” is not a synonym for “zero”
Results below reporting limits are censored (cut-off) data, not measured zeros. Replacing <0.1 µg/L with zero, with 0.1 µg/L, or with half the reporting limit for further statistical calculations creates three different artificial datasets. The appropriate treatment depends on the purpose of the assessment, the proportion of censored data and the statistical method used (Analytical Methods Committee, 2001, 2020). This may be unimportant for simple screening, but it can materially affect trend analysis, contaminant-load calculations, background estimates and statistical comparisons.
Laboratory uncertainty is not the whole uncertainty
A laboratory may report 50 ±5 mg/kg with excellent precision, but that does not establish that 50 mg/kg represents a heterogeneous site. Laboratory uncertainty normally concerns the defined procedure and test portion under laboratory control; it does not automatically include borehole location, sample number or depth, soil heterogeneity, field sampling, storage, transport or representativeness (Environment Agency, 2021).
In contaminated land, sampling uncertainty, sub-sampling uncertainty and analytical uncertainty are distinct but related. In a heterogeneous site, sampling uncertainty may be much larger than laboratory uncertainty. There is little value debating whether analytical uncertainty is 8% rather than 10% if the sampling programme cannot establish natural variation in the material being assessed.
Precision is not the same as accuracy: repeated results can agree closely yet all be biased – deviate from the correct or accurate value. Method validation therefore considers precision, bias and recovery rather than repeatability alone (Cantwell, 2025; Environment Agency, 2023). Similarly, reporting extra decimal places does not create extra confidence; 12.347 ±2.1 mg/kg does not support interpretation to three decimal places.
When the method cannot reach the decision concentration
If an assessment criterion is 0.001 µg/L but the best achievable reporting limit is 0.005 µg/L, a result of <0.005 µg/L cannot demonstrate compliance. The correct conclusion is that the method cannot determine whether the concentration is above or below the criterion. Options may include a more sensitive method, a different laboratory, additional clean-up, reduced dilution, increased sample mass or volume where appropriate, confirmatory analysis, alternative lines of evidence or explicit acknowledgement of the limitation in the risk assessment.
This issue is increasingly relevant for PFAS, pharmaceuticals, pesticides and other emerging contaminants, where assessment criteria can be exceptionally low. A larger analytical suite is not automatically better than a smaller one; the essential question is whether the method is fit for the environmental decision being made (Cantwell, 2025).
A better way to design contaminated-land analysis
Rather than beginning with a laboratory’s standard analytical package, begin with the decision:
- Identify the contaminant of concern.
- Identify the relevant assessment criterion.
- Confirm that the laboratory can achieve an appropriate reporting limit relative to that criterion.
- Understand method performance, including precision, bias, recovery, accreditation scope and measurement uncertainty.
- Consider whether matrix effects or dilution could increase reporting limits.
- Decide in advance how borderline results will be interpreted and whether a decision rule is required.
- Confirm that the sampling strategy can produce material representative of the population or area being assessed.
Practitioners should also ask whether the method is accredited for the relevant matrix and analyte; whether results are dry-weight or as-received; how results between detection and quantification limits are handled; how dilution affects reporting limits; and whether reported uncertainty includes sampling. Usually it will not unless sampling has been included in the measurement procedure and uncertainty evaluation.
The key concept: uncertainty is information
Measurement uncertainty is sometimes viewed as weakening a result. In reality, it describes the result more fully. It helps the practitioner judge whether apparent differences between samples are significant, whether trends exceed analytical variability, how confidently a result can be compared with a decision threshold and whether confirmation may be justified. Detection and reporting limits provide the same type of information: they define what the analytical method can and cannot establish.
Conclusion
Analytical chemistry does not produce perfect numbers. It produces measurement results with limitations. Four questions should accompany every important contaminated-land result:
| Food for thought – Questions to ask of an analytical result |
| What could the laboratory detect? |
| At what concentration can it quantify reliably? |
| What uncertainty is associated with the reported value? |
| Is the overall sampling and measurement process capable of supporting the environmental decision? |
Table 2 Food for thought: key questions for interpreting an analytical result
A result of <0.01 mg/kg does not mean zero. A result of 10.2 mg/kg does not mean the concentration is known exactly to 0.1 mg/kg. An uncertainty of ±2 mg/kg cannot simply be added or subtracted according to which conclusion is preferred.
As assessment criteria become lower and analytical decisions become more demanding, particularly for emerging contaminants, understanding detection limits, reporting limits and measurement uncertainty will become more important, not less. The most useful question when reviewing a laboratory certificate may therefore be not “What number did the laboratory report?” but “How certain am I that this analytical result is capable of supporting the decision I am about to make?”
References
Analytical Methods Committee (1987) ‘Recommendations for the definition, estimation and use of the detection limit’, Analyst, 112, pp. 199–204. doi:10.1039/AN9871200199.
Analytical Methods Committee (2001) ‘Measurement of near zero concentration: recording and reporting results that fall close to or below the detection limit’, Analyst, 126(2), pp. 256–259. doi:10.1039/B009590G.
Analytical Methods Committee (2020) ‘The edge of reason: reporting and inference near the detection limit’, Analytical Methods, 12, pp. 401–403. doi:10.1039/C9AY90188D.
Cantwell, H. (ed.) (2025) The Fitness for Purpose of Analytical Methods: A Laboratory Guide to Method Validation and Related Topics. 3rd edn. Eurachem.
Ellison, S.L.R. and Williams, A. (eds.) (2012) Eurachem/CITAC Guide: Quantifying Uncertainty in Analytical Measurement. 3rd edn. Eurachem. ISBN 978-0-948926-30-3.
Environment Agency (2021) Using MCERTS for the Chemical Testing of Soil. Bristol: Environment Agency.
Environment Agency (2023) MCERTS: Performance Standard for Laboratories Undertaking Chemical Testing of Soil. LIT 6625. Bristol: Environment Agency.
ILAC (2019) ILAC-G8:09/2019: Guidelines on Decision Rules and Statements of Conformity. International Laboratory Accreditation Cooperation.
ISO/IEC (2017) ISO/IEC 17025:2017: General Requirements for the Competence of Testing and Calibration Laboratories. Geneva: International Organization for Standardization.
JCGM (2008) Evaluation of Measurement Data – Guide to the Expression of Uncertainty in Measurement. JCGM 100:2008. Joint Committee for Guides in Metrology.
JCGM (2012) Evaluation of Measurement Data – The Role of Measurement Uncertainty in Conformity Assessment. JCGM 106:2012. Joint Committee for Guides in Metrology.
Nathanail, C.P., McCaffrey, C., Gillett, A.G., Ogden, R.C. and Nathanail, J.F. (2015) The LQM/CIEH S4ULs for Human Health Risk Assessment. Nottingham: Land Quality Press. ISBN 978-0-9931084-0-2.
Thompson, M. and Ellison, S.L.R. (2013) ‘Towards an uncertainty paradigm of detection capability’, Analytical Methods, 5, pp. 5857–5861. doi:10.1039/C3AY41209A.
Article provided by Ken Scally¹˒² Paul Nathanail3
¹ Calibre Scientific, Shannon Free Zone, Co. Clare, Ireland
² Department of Earth and Environmental Sciences, Mount Royal University, Calgary, Alberta, Canada
3 Land Quality Management, UK