 Search
The increased level of data sharing for the 2025 reporting year has provided a more comprehensive and representative picture of safety performance across the geotechnical and geoenvironmental sectors. Greater participation and a more diverse dataset have strengthened the value of what we have received, enabling more meaningful trend analysis and industry-wide learning. This continued commitment to transparency supports informed decision-making, helps identify emerging risks and areas for improvement, and encourages greater collaboration between organisations. As reporting levels continue to grow, the industry is better positioned to move beyond compliance and foster a proactive, learning-focused safety culture where collective responsibility and workforce wellbeing remain at the heart of operational excellence.
2025 AGS Industry Accident Data
The health, safety and operational performance data submitted for the 2025 reporting period captures detailed information on RIDDOR-reportable incidents, non-RIDDOR injuries, near misses, vehicle-related incidents and mental health-related absences. The data also breaks down incidents by accident type, injury severity and body part affected, enabling comparisons between organisations of different sizes and operational profiles. This information forms the basis for identifying industry trends, benchmarking performance, understanding key sources of risk and supporting targeted initiatives aimed at improving health, safety and wellbeing across the geotechnical and geoenvironmental sector.
AGS Accident Incident Rate (AIR) and Accident Frequency Rate (AFR) Summary
Accident Incident Rate (AIR) and Accident Frequency Rate (AFR) are key health and safety performance indicators used to measure and compare safety performance across organisations of different sizes. AIR measures the number of RIDDOR-reportable injuries relative to workforce size, while AFR measures the frequency of accidents in relation to the total hours worked.
To ensure consistency with previous years and maintain alignment with established industry reporting practices, the same following two accident and incident rate metrics have been applied when calculating the 2025 figures:
Accident Incident Rate (AIR) – (number of RIDDOR reportable accidents / average workforce headcount) x 100,000.
Accident Frequency Rate (AFR) – (total number of harm accidents / total number of hours worked) x 1,000,000.
The graphs below show that the average AIR and AFR have fluctuated over the 5-year reporting period, indicating varying levels of safety performance across the industry. AIR peaked in 2025 at 175.87, suggesting a higher rate of RIDDOR-reportable injuries relative to workforce size, while AFR reached a peak in 2022 at 28.55, reflecting an increase in accidents relative to hours worked. Despite these annual variations, the 5-year average AIR of 96.06 and AFR of 18.78 provide a longer-term measure of industry safety performance, helping to identify overall trends and place annual results into a broader context.
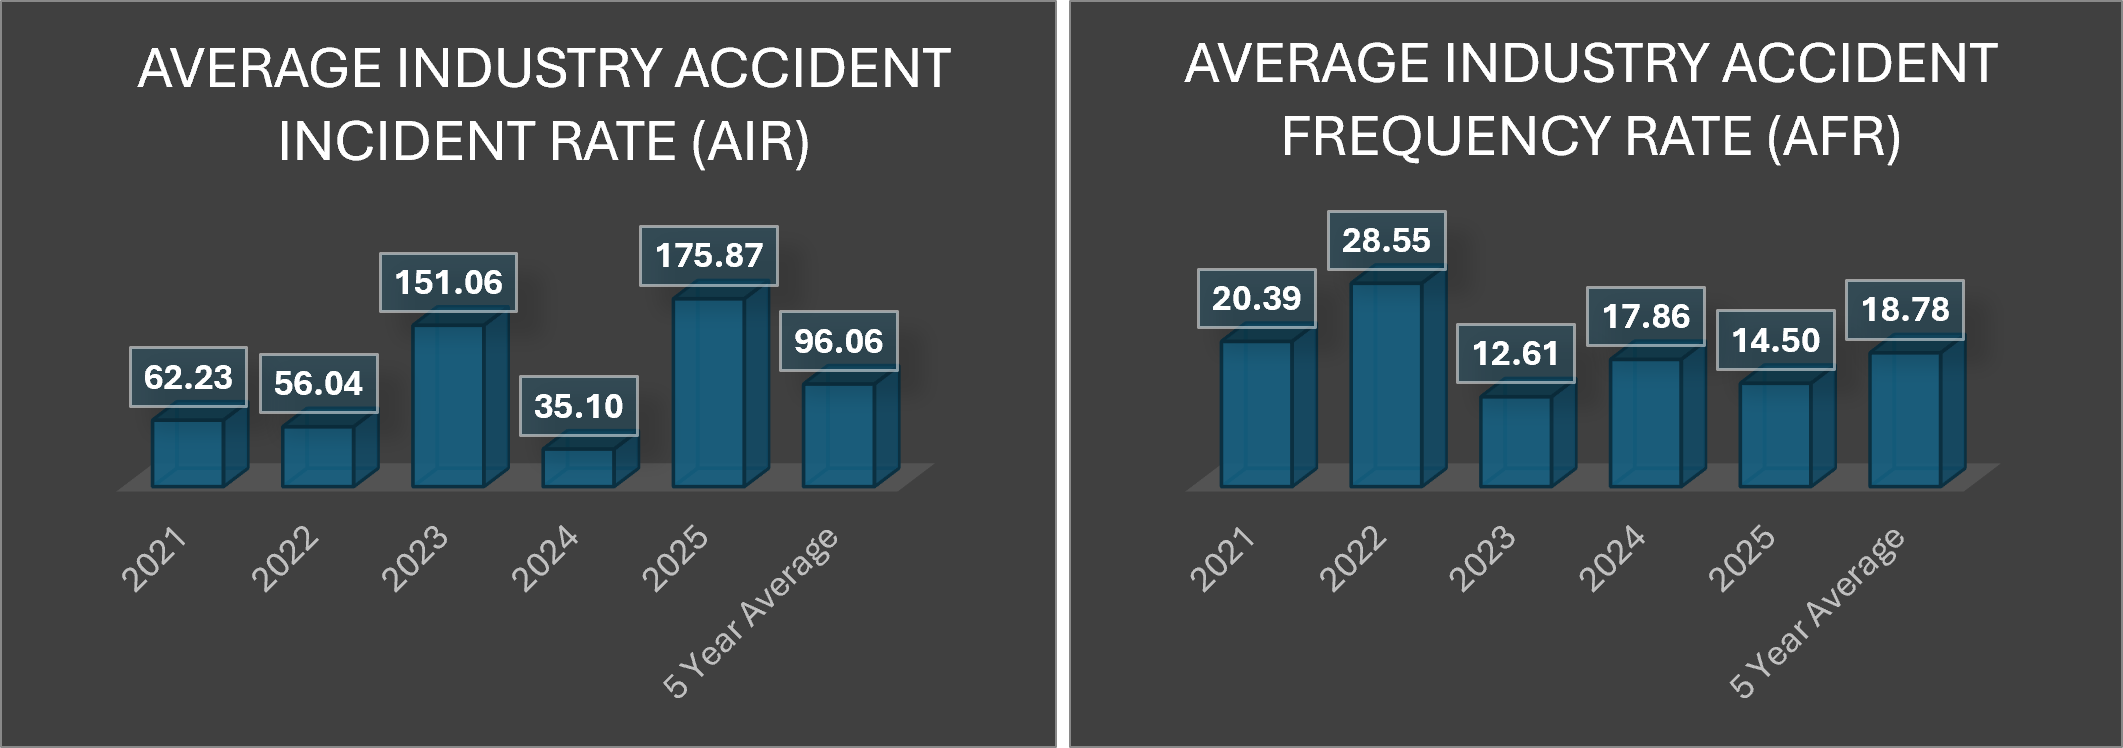
The following section examines how the AIR and AFR vary according to contractor size over the past 5-year reporting period. By comparing performance across different workforce bands, it is possible to identify trends, highlight areas of elevated risk, and better understand the factors influencing safety outcomes across the industry. The analysis provides valuable insight into how organisational scale may affect accident and incident reporting, while helping to inform targeted improvement initiatives and future safety strategies.
AGS AIR Summary
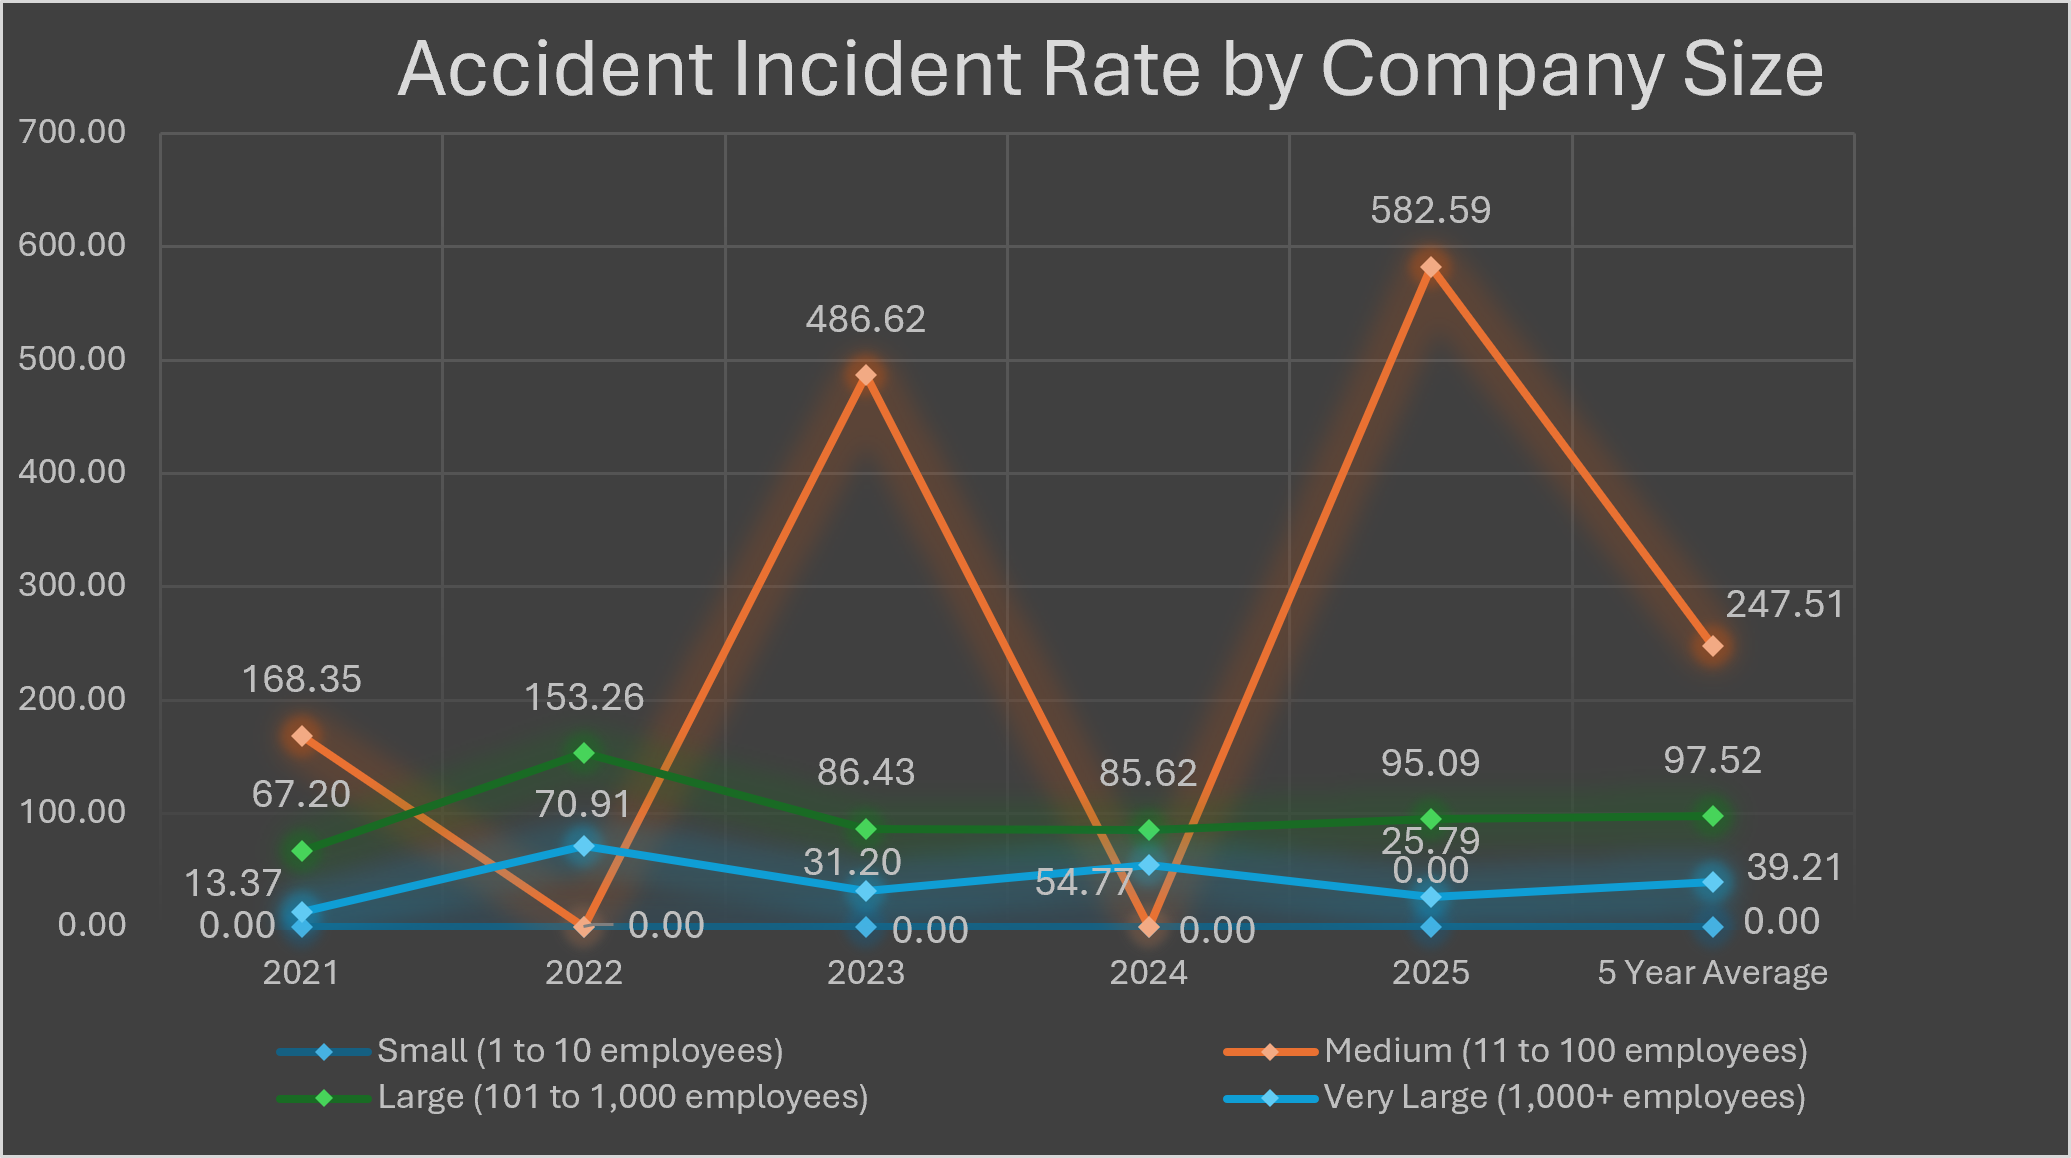
The Accident Incident Rate (AIR) highlights a clear relationship between contractor size and reported incident rates. No incidents were reported by small contractors (1–10 employees) during the reporting period, however, the relatively limited sample size within this group means the results should be interpreted with caution. As a result, the absence of reported incidents is not necessarily indicative of superior safety performance and may not provide a reliable basis for wider industry comparisons.
Medium-sized contractors (11-100 employees) recorded the highest rates by a considerable margin. Their 5-year average of 247.51 is more than 2.5x the overall industry average of 96.06, driven by exceptionally high values in 2023 (486.62) and 2025 (582.59). However, the zero values recorded in 2022 and 2024 have reduced the overall average, and it should be recognised that, until a larger and more complete dataset is available, the calculated average may not fully reflect the true level of industry performance.
In contrast, large contractors (101-1,000 employees) displayed the most consistent performance across the 5-year period. Their rates ranged from 67.20 to 153.26, resulting in a 5-year average of 97.52, almost identical to the overall industry average of 96.06. This consistency suggests that larger organisations may benefit from more mature health and safety management systems and a broader employee base that stabilises annual reporting rates.
Very large contractors (1,000+ employees) recorded the lowest overall rates, with a 5-year average of 39.21, less than half the industry average. Although some year-to-year variation was evident, particularly in 2022 (70.91) and 2024 (54.77), their reported rates remained comparatively low throughout the period. Similarly to the large contractor size outcome mentioned above, this trend may reflect the influence of well-established safety cultures, dedicated H&S resources, and greater investment in risk management processes.
AGS AFR Summary
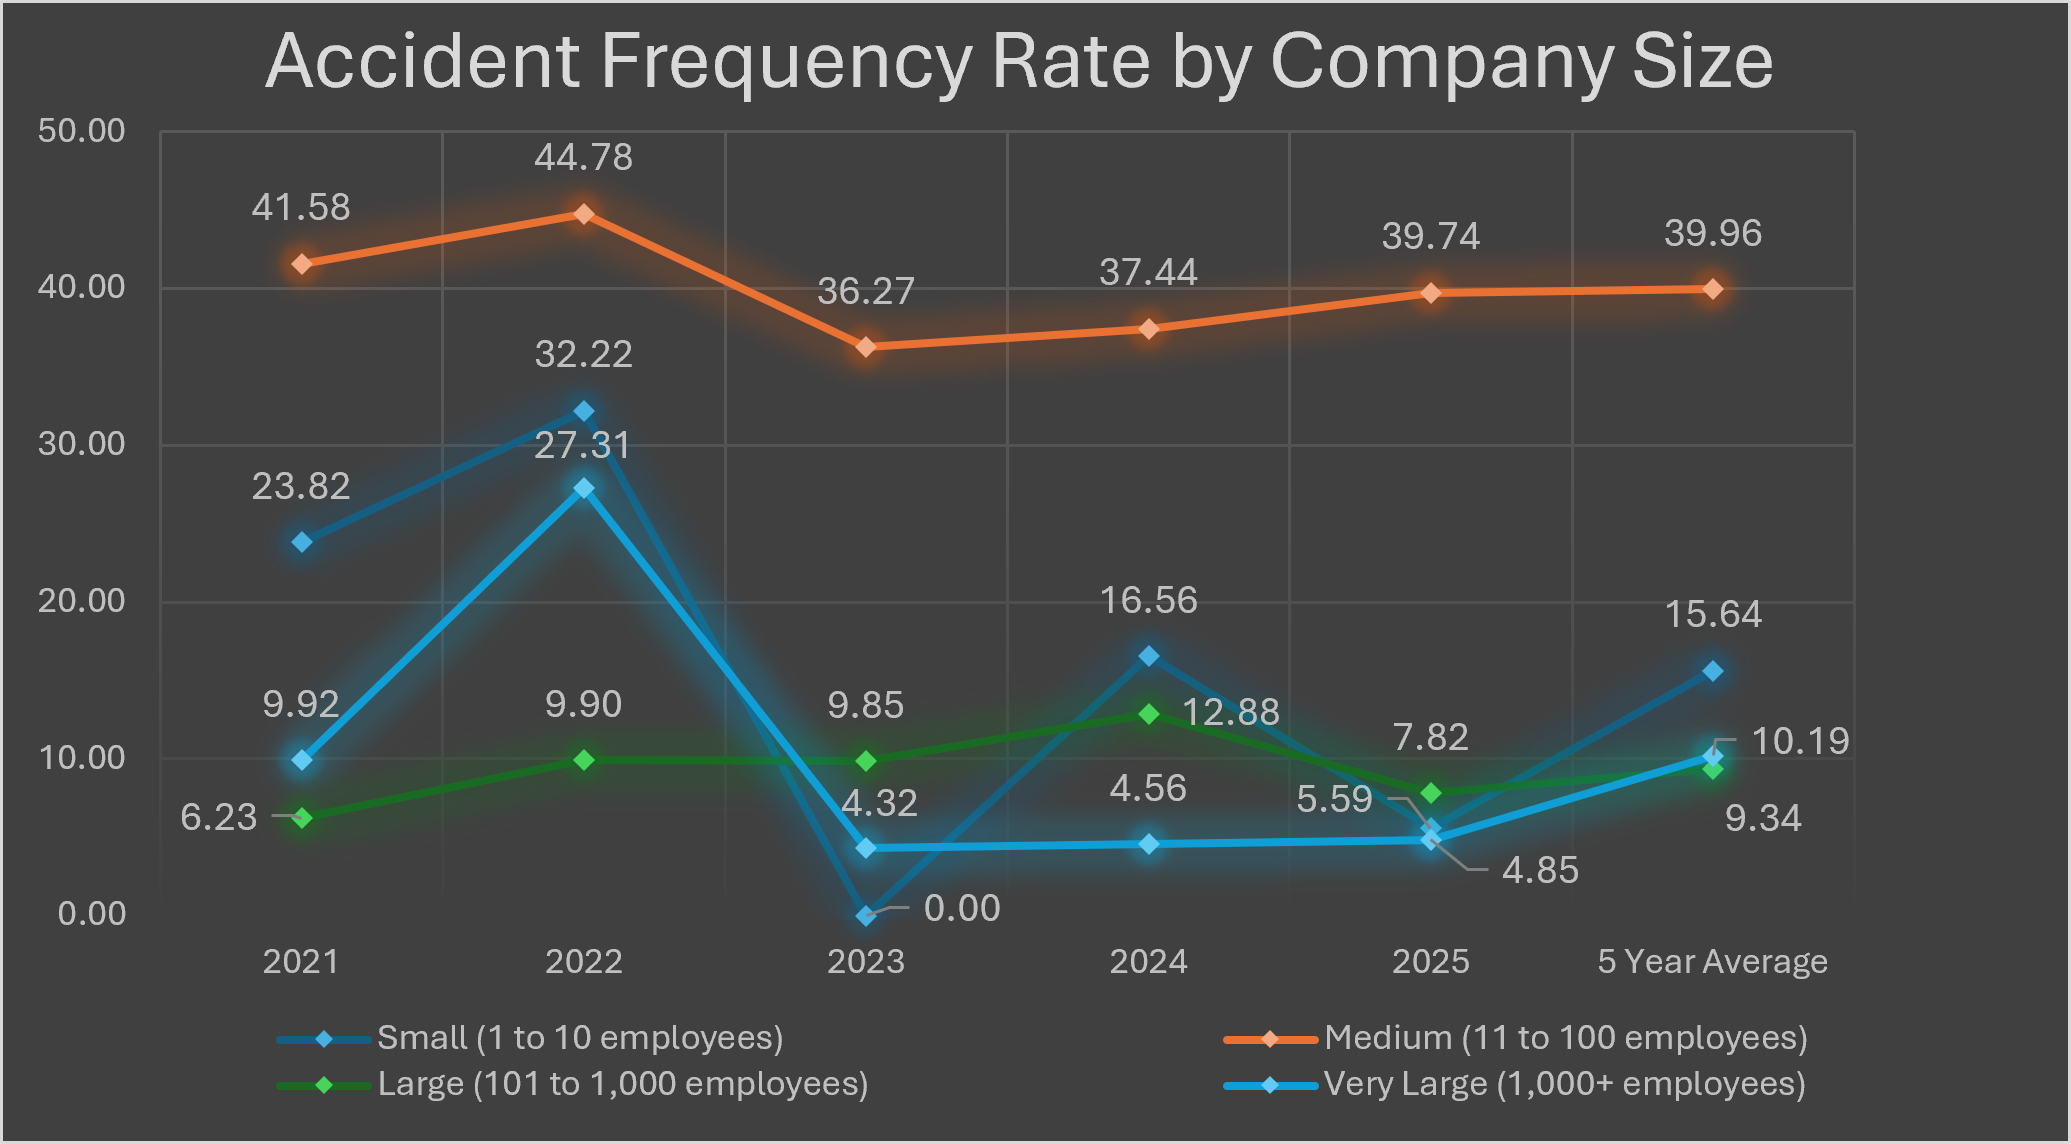
Analysis of the Accident Frequency Rate (AFR) data shows a clear trend of higher accident rates among medium-sized contractors, whilst the other organisational groups report lower rates. The overall industry 5-year average AFR was 18.78.
Medium-sized contractors (11-100 employees) recorded the highest accident frequency rates throughout the reporting period, with a 5-year average of 39.96, more than double the industry average. Rates remained consistently high, ranging from 36.27 to 44.78, suggesting that this contractor group faces persistent challenges in managing workplace safety. Unlike other groups, there were no significant reductions or exceptional years, indicating a sustained pattern of elevated risk.
Small contractors (1-10 employees) recorded the second-highest 5-year average AFR at 15.64, although annual performance fluctuated considerably. The variability in rates across the years is likely influenced by the small workforce size, where a single accident can have a significant affect on the overall rate. Despite these fluctuations, the 5-year average remained below the industry benchmark.
Large contractors (101-1,000 employees) demonstrated consistently strong safety performance, recording a 5-year average AFR of 9.34, around half the industry average. Annual rates remained stable between 6.23 and 12.88, indicating effective safety management systems and a well-established approach to risk control.
Similarly, very large contractors (1,000+ employees) achieved a low 5-year average AFR of 10.19. While 2022 saw a temporary increase to 27.31, accident rates fell sharply in subsequent years, with values of 4.32, 4.56 and 4.85 recorded between 2023 and 2025. These figures represent some of the lowest accident frequency rates across all contractor groups and again highlight the benefits of mature health and safety systems, dedicated resources, and strong organisational safety cultures.
Overall, the data suggests that accident frequency rates generally decrease as contractor size increases, with the exception of medium-sized contractors who continue to experience the highest levels of workplace accidents, whereas large and very large organisations consistently outperform the industry average. The findings from both the AIR and AFR analysis highlight the value of robust health and safety management systems and suggest that medium-sized organisations, particularly those experiencing growth, may benefit from additional resources, support and targeted interventions to maintain strong safety performance and reduce accident rates.
Injury Trends and Key Findings
Across the survey, RIDDOR-reportable incidents were reported much less frequently than minor injuries, indicating that the majority of injuries continue to arise from routine workplace activities, everyday behaviours and low-level hazards rather than major safety failures. Whilst this reflects a relatively low incidence of serious injuries across the industry, it also demonstrates the importance of identifying and addressing lower-level hazards and recurring workplace risks. Proactive management of these issues can help prevent escalation into more serious events, reducing the likelihood of future RIDDOR-reportable incidents and supporting continued improvements in overall safety performance.
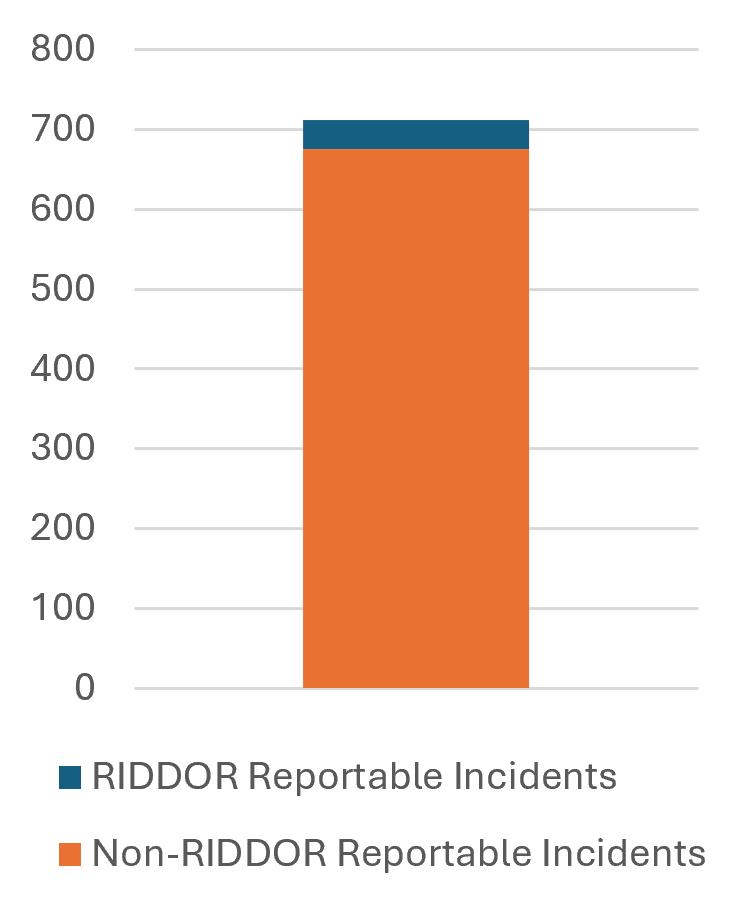
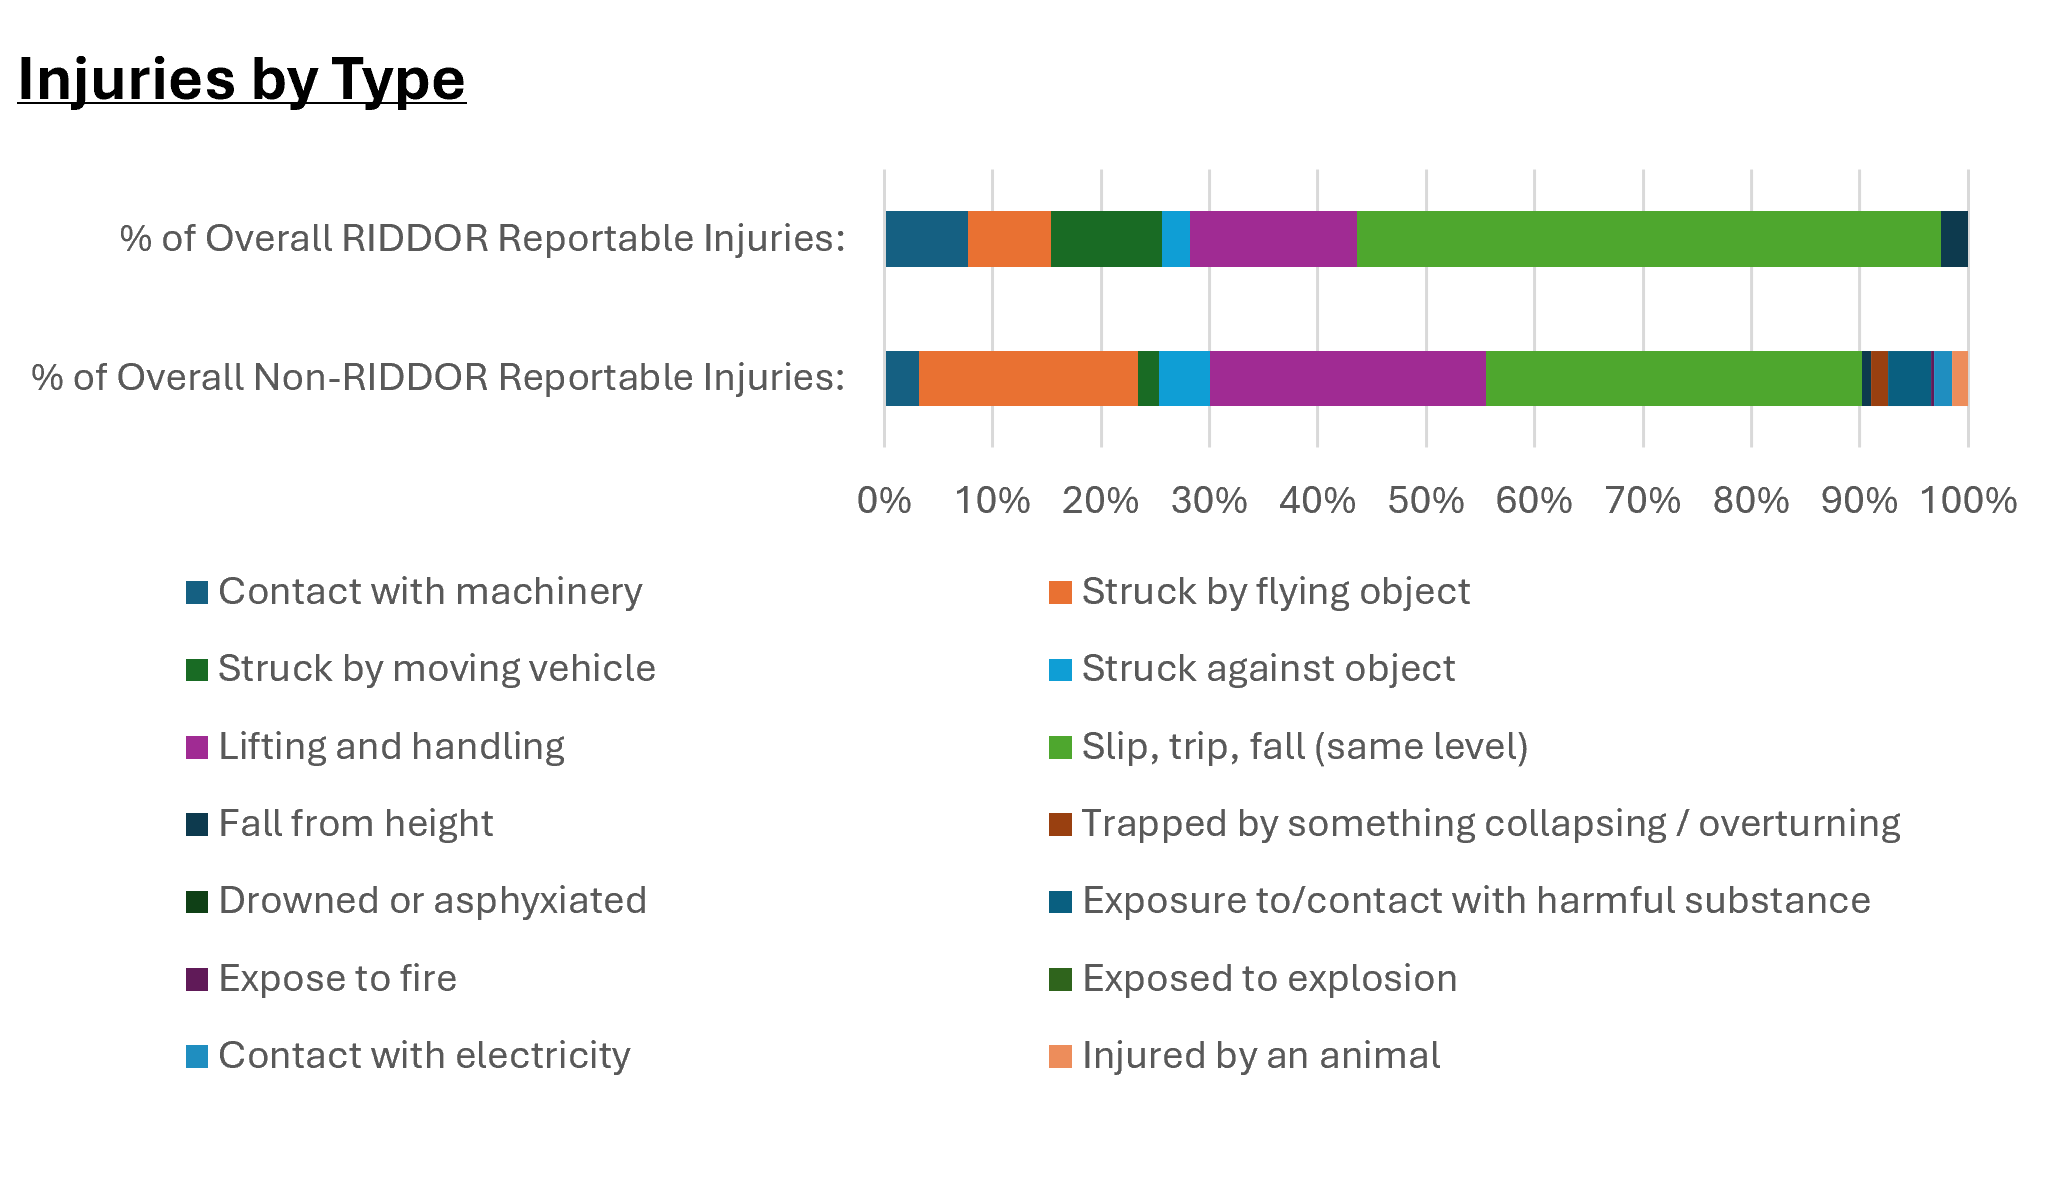
Analysis of the RIDDOR-reportable data shows that serious injuries are largely driven by the same activities responsible for the highest number of minor injuries. Slips, trips and falls on the same level accounted for more than half of all RIDDOR-reportable incidents, while lifting and handling activities contributed a further 15%. Together, these categories represented almost 70% of all serious injuries reported. This suggests that the industry’s most significant injuries are not typically the result of rare or catastrophic events but instead arise from routine activities carried out daily across a wide range of projects and workplaces. This reinforces the importance of learning from lower-level incidents and near misses, as addressing their underlying causes can help prevent more serious accidents and reduce the likelihood of future RIDDOR-reportable events.
A similar pattern was observed within the non-RIDDOR reportable data. Slips, trips and falls on the same level accounted for more than one-third of all reported injuries, with lifting and handling incidents contributing a further quarter. Injuries caused by flying objects also featured prominently, representing over 20% of all cases. Collectively, these three categories accounted for more than 80% of all non-RIDDOR injuries reported.
Traditionally high-consequence incident types, such as falls from height, vehicle-related incidents, electrical contact and structural collapse events, were reported relatively infrequently in both RIDDOR and non-RIDDOR data. This suggests that existing controls for higher-risk activities are generally effective, while the greatest opportunity for further injury reduction lies in strengthening the management of routine workplace hazards.
The prevalence of slips, trips and falls highlights the ongoing challenges presented by everyday site conditions, including uneven ground, poor housekeeping, adverse weather and muddy working environments. Despite being largely preventable, these incidents remain the single largest contributor to injury statistics across the sector. Likewise, the high number of lifting and handling injuries reinforces the physical nature of much of the work undertaken by AGS members and demonstrates the continued need for effective manual handling practices, task planning and the use of suitable lifting aids where practicable. Injuries resulting from flying objects remain a notable concern and may be associated with activities such as excavation works, drilling operations, plant use and the operation of hand tools. Continued emphasis on exclusion zones, equipment maintenance, safe systems of work and appropriate personal protective equipment is therefore essential.
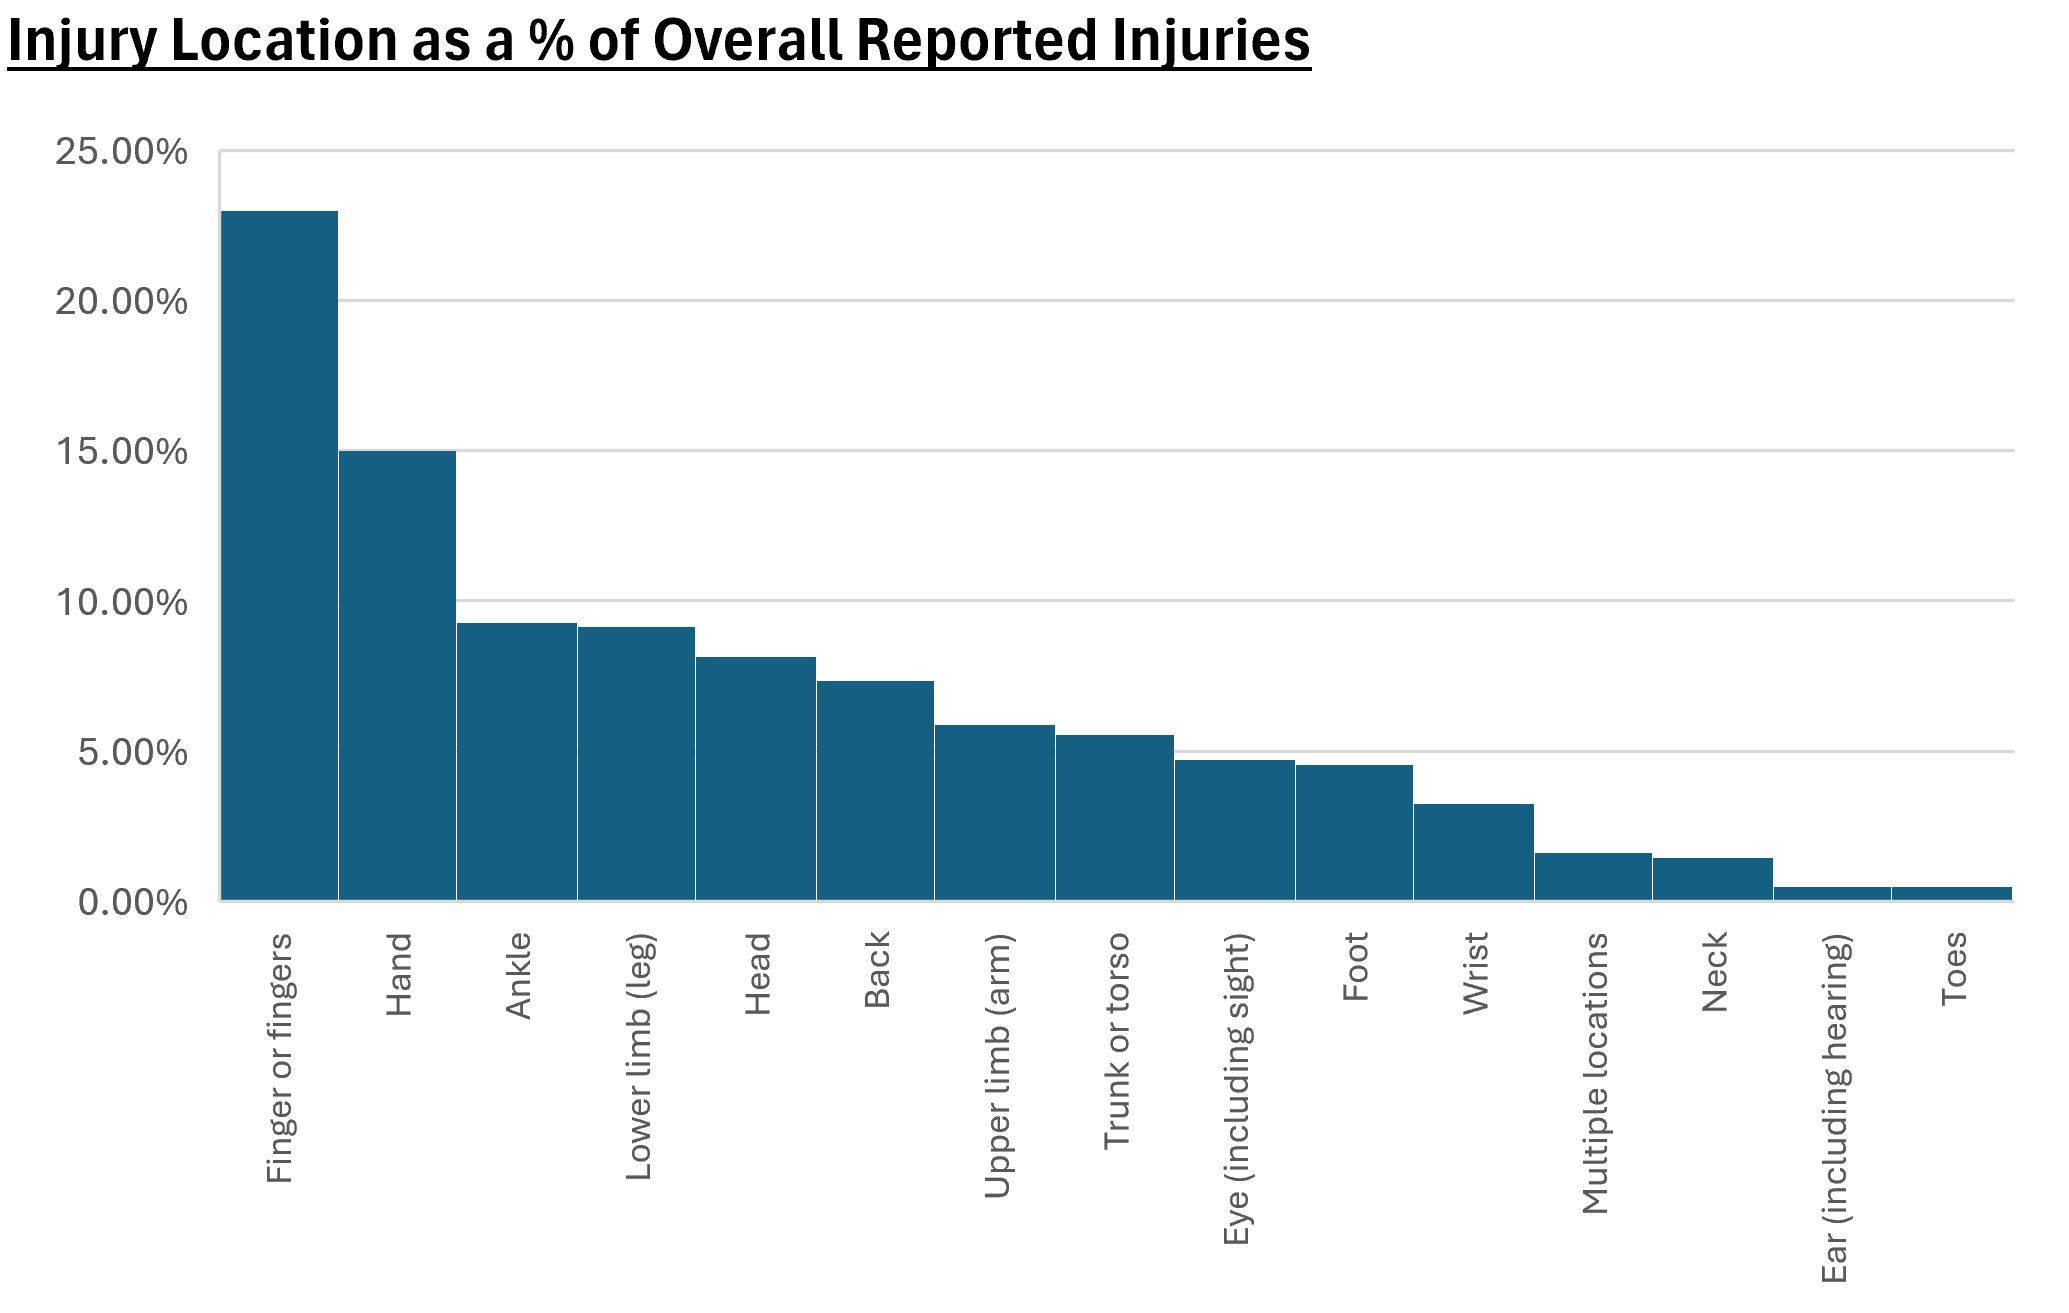
Analysis of injury locations further supports the findings from injuries reported by type. Injuries to the hands and fingers accounted for 38% of all reported injuries as seen in the graph above, making them by far the most affected parts of the body. This reflects the hands-on nature of the work undertaken across the industry and highlights the importance of maintaining high standards of manual handling, equipment operation and hand protection. Injuries affecting the lower limbs, including the legs, ankles and feet, accounted for a further 23% of reported cases and are likely linked to the high prevalence of slip, trip and fall incidents. Head and back injuries together represented approximately 15% of all injuries, reinforcing the importance of continued focus on site awareness, workplace organisation and ergonomic working practices.
Overall, the findings demonstrate that the greatest opportunity for reducing injury rates across the industry lies in preventing low-consequence but high-frequency incidents. By maintaining a strong focus on behavioural safety, risk awareness, workplace housekeeping, manual handling and routine task management, organisations can continue to reduce injury rates and further strengthen health and safety performance across the sector.
The Construction Industry
A comparison of the AGS Accident data with wider HSE non-fatal injury statistics for the construction industry, reveals both similarities and notable differences in the industry injury profile. In both datasets, slips, trips and falls on the same level remain the leading cause of injury, accounting for 36% of all AGS Member injuries compared with 25% across the industry as a whole. Similarly, lifting and handling incidents represent a significant proportion of injuries, accounting for 25% of AGS Member incidents compared with 17% nationally.
A particularly notable difference is the proportion of injuries caused by flying objects, which account for 19% of all AGS Member injuries, compared with 12% nationally for incidents involving moving, flying or falling objects. This likely reflects the practical and site-based nature of AGS Members’ work as previously mentioned. Conversely, falls from height account for just 1% of AGS Member injuries, significantly lower than the 20% reported across wider industry, suggesting that either exposure to work at height is comparatively limited or that controls in this area are proving effective.
Vehicle-Related Risk Remains Significant
Numerous organisations reported both own-fault and non-fault vehicle accidents during the reporting period. Given the significant amount of driving undertaken by AGS members to support site investigations, utility surveys, environmental monitoring, and the transport of laboratory samples (to name a few), vehicle safety continues to represent one of the industry’s highest exposure risks. Driving remains one of the most frequent occupational activities across the sector, and the continued occurrence of vehicle-related incidents within the survey results highlights the importance of maintaining strong driver safety initiatives, effective journey planning and ongoing risk awareness. Opportunities also exist to further reduce exposure to road-related risks through additional driver training and by promoting alternative travel methods where appropriate. For employees who do not require a vehicle for their role, greater use of public transport or other sustainable travel options may help reduce both driving-related risks and overall time spent on the road.
Near Miss Reporting Appears Healthy
Several organisations reported notably high numbers of near-miss incidents, with individual returns including 513, 300, 205 and 131 reports, alongside many other companies recording substantial reporting figures. While these numbers may initially appear concerning, they are generally indicative of a positive and proactive health and safety culture. Strong near-miss reporting creates valuable opportunities to identify hazards, investigate underlying causes and implement corrective actions before injuries or more serious incidents occur. The volume of near-miss reporting observed within parts of the industry may therefore reflect a maturing reporting culture, where employees are increasingly engaged in recognising and reporting unsafe conditions and behaviours. Continued encouragement of open reporting and shared learning will be key to further improving health and safety performance across the sector.
Mental Health Impacts Are Low in Number but Potentially High in Consequence
Most organisations reported zero lost working days attributable to mental health-related absences, suggesting that such cases either remain relatively infrequent across the survey population, or that under-reporting or classification differences may exist, with some absences potentially being recorded under other sickness categories rather than specifically as mental health-related absences. It could also mean that current mental health support measures may be proving effective, helping employees manage issues before they result in time away from work.
A small number of companies reported high levels of lost time, with some recording losses equivalent to as much as 6% of their total hours worked for the reporting period. While such cases remain relatively uncommon, the data demonstrates that when mental health-related absences do occur, they can have a considerable impact on both workforce availability and organisational productivity.
These findings highlight the importance of continued investment in employee wellbeing initiatives, mental health support and early intervention measures to help reduce the duration and severity of cases. Furthermore, the increasing number of participating employees and total hours worked represented within the survey enhances the value of the benchmarking exercise, providing a broader data set and strengthening confidence in the trends and conclusions identified across the industry.
AGS and BDA Collaboration
The AGS and BDA have continued to collaborate on accident statistics, with the ultimate aim of identifying common trends across the industry that can be explored and analysed further. As the accident statistics submitted to the AGS include data from both BDA and non-BDA organisations, this provides an opportunity to identify trends specifically amongst BDA members and compare these with those reported by non-BDA organisations, highlighting any notable similarities or differences.
Several non-BDA organisations reported substantially higher injury totals than the wider survey average, with as many as 354 minor injuries and 18 RIDDOR-reportable incidents, while other companies reported minor injuries in the 40’s. Although these figures indicate that some of the highest injury rates were recorded by non-BDA members, the data does not reveal any clear trend associated with BDA membership. A number of BDA organisations demonstrated healthy levels of near-miss reporting alongside relatively low injury numbers, which may be indicative of a proactive reporting culture and effective incident prevention measures. However, several of the highest near-miss reporting figures were also recorded by non-BDA organisations, suggesting that positive reporting behaviours are present across both groups.
Looking ahead to 2026-2027, the AGS intends to strengthen its collaboration with the BDA to facilitate the sharing of additional health and safety statistics from organisations that hold membership with both associations. This initiative is expected to improve the quality and reliability of data returns, providing a more representative picture of overall industry performance.
Continued engagement from AGS members remains vital, and we strongly encourage the submission of complete, accurate and up-to-date statistics to support annual review and analysis. This year, responses were received from 35% of AGS members, representing a 13% increase compared with the previous year. While this is a positive step forward, further participation is essential to ensure the data set is sufficiently comprehensive to provide a robust overview of health and safety performance across the industry. We remain optimistic that response rates will continue to improve, helping to drive greater engagement and deliver increasingly meaningful insights into industry health and safety trends.
Conclusion
The 2025 AGS health and safety data present a detailed snapshot of safety performance across the geotechnical and geoenvironmental industry, with increased participation further improving the quality and representativeness of the dataset. The findings show that most injuries continue to arise from routine workplace activities, particularly slips, trips and falls, manual handling tasks, and hand injuries, highlighting where the greatest opportunities for improvement remain. While larger organisations generally reported lower accident rates, the data suggests that medium-sized companies may benefit from additional support as they grow. Encouragingly, strong levels of near-miss reporting indicate a positive safety culture across much of the industry. Continued collaboration, transparent reporting and proactive risk management will be essential in driving further improvements in health, safety and wellbeing throughout the sector.
Article provided by Rachael Parry TechIOSH CMgr MCMI, Geotechnical Engineering Ltd Operations Support Manager