The way a soil sample is prepared prior to analysis varies between laboratories. In the September 2011 issue of AGS News we presented an article entitled ‘On Stoney Ground’ in which we discussed the results of a sample preparation survey of the main commercial MCerts accredited laboratories. The survey revealed significant differences in whether stones were removed or crushed prior to the analysis for metals, whether PAHs were tested on as received or air-dried samples, and in the solvents used for PAH and TPH extraction. We have recently repeated our laboratory survey to see if the laboratories have become more ‘standardised’ over the last decade.
In 2015 the Standing Committee of Analysts (established by the Department of the Environment in 1972) published ‘The preparation and pre-treatment of potentially contaminated soils and associated materials’ (the “Blue Book” method) which provides authoritative guidance on recommended methods for sample preparation. The Blue Book states that ‘it is crucial that the client/supplier of the samples is aware of the default laboratory method and specifies the requirements for each batch of samples submitted ‘. However, our experience suggests that the majority of those scheduling chemical analyses are unaware of the potential differences between laboratory sample preparation methods.
Metals Analysis
The Blue Book acknowledges that contaminants are not distributed evenly between the fines and the larger particles within a soil and presents two “standardised” methods for preparing soil samples prior to chemical analysis. In one method the whole sample is dried, ground and homogenised; this method is for general site assessment and waste classification. In the other method only the <2mm fraction is analysed following sieving; this method is used for human health risk assessment.
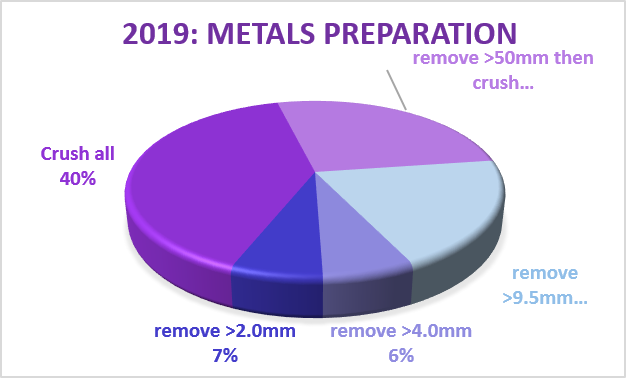
In 2010 just under half of the laboratories surveyed dried and crushed the whole sample for the metals analysis, one third removed the stones greater than 10mm, two laboratories removed the stones greater than 2mm and a single laboratory removing all ‘inert’ stones. If we assume that laboratories are not receiving samples containing particles larger than one third of the tub diameter, two thirds of laboratories are now drying and crushing the whole sample, but only one laboratory is following the alternative <2mm sieve preparation method. The remaining quarter of the laboratories are not following a Blue Book method and remove stones of between 4mm and 10mm.
But Does it Matter?
If a sample that contains a significant proportion of metal-rich clinker or slag was submitted to a range of MCerts accredited laboratories, two- thirds of the laboratories would report greater concentrations of the metallic contaminants than the remaining third. This remaining third could be expected to produce a range of results for the same sample, dependent upon the particle size of the slag and clinker. Only one of the fifteen MCerts accredited laboratories that responded to the survey would by default, produce a result that would be appropriate for the assessment of the likely potential human health exposure routes. Furthermore, whilst most commercial laboratories can offer the analysis of the <2mm fraction, in accordance with the Blue Book method, they report that it is unusual for them to be requested to do so. It would therefore appear that where a human health risk assessment is being carried out, the significance of the particle size being analysed is frequently not being considered by those scheduling the analyses. Alternatively, analyses are being scheduled for multiple purposes (human health risk assessment, waste classification, pipe selection, groundwater risk etc.) and an overly conservative approach to human health risk assessment is being adopted.
PAH Analysis
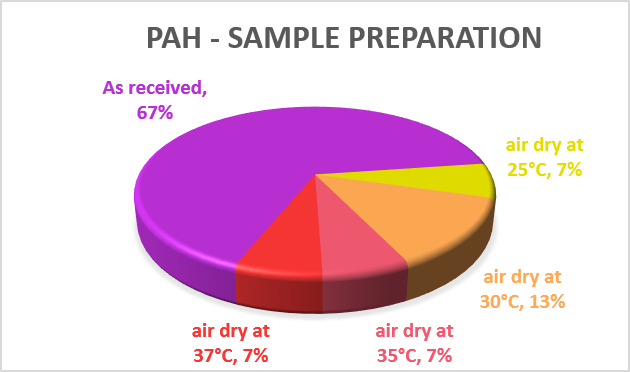
A decade ago, just under half of the laboratories reported that they tested the as-received sample; this figure has now risen to two-thirds. Those that dry and crush or sieve the sample do so at temperatures ranging from 20°C to 37°C.
Samples for PAH analysis are required to be stored in a glass container, under cold conditions, to minimise the potential losses by volatilisation. Indeed, if they are not, they may be listed as being a ‘deviating’ sample under the MCerts scheme. It is therefore surprising to see that these same samples can then be air dried at 37°C without such losses occurring.
It may be that, as PAHs in soil are typically present in a complex mixture bound with long chain hydrocarbons, that the volatility of naphthalene is reduced and that negligible losses actually occur at temperatures of up to 37°C. It would be interesting to see if any research has been carried out to assess the potential for such losses in ‘real’ soils both during air drying in the laboratory and in the period between sampling and testing when stored in glass verses plastic containers. However, to minimise uncertainty, it may be best to keep holding times to a minimum and to analyse the as-received sample as soon as possible.
Extraction Solvent
The solvent(s) used to extract hydrocarbons and PAHs varies between laboratories and as each solvent or mix of solvents will have a different extraction efficiency for different compounds, there is the potential for some variation in the TPH or PAH measurement of the same sample between the laboratories. In 2010 three-quarters of laboratories were using dichloromethane (DCM) as the extraction solvent, with others using DCM/hexane, hexane/acetone or pentane. The plots below indicate the solvents used today.
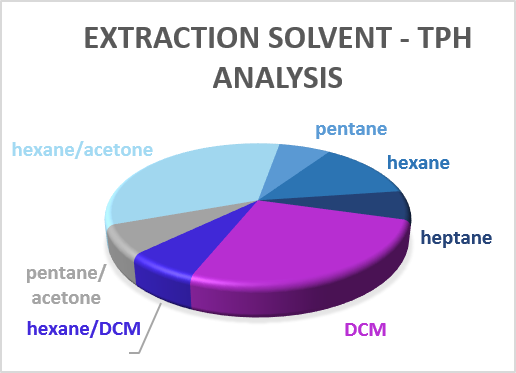
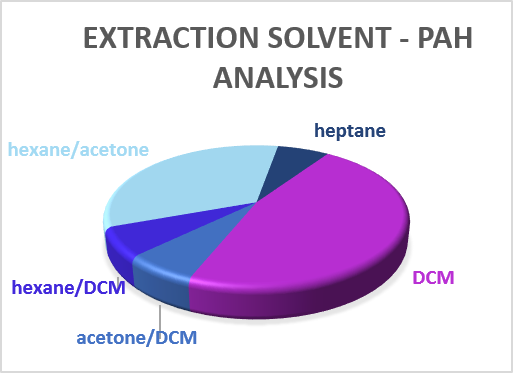
Whilst DCM still dominates, far more laboratories are using hexane/acetone than in 2010 and a greater range of other solvents are now used by different laboratories. If data sets over an extended period are to be compared to study long-term trends, it would therefore be worth checking with the laboratory that the extraction solvent (and test method) has remained constant over the period of monitoring.
But Does it Matter?
To comply with MCerts accreditation, laboratories have to take part in an inter-lab proficiency scheme such as CONTEST. Under such schemes each laboratory analyses the same sample and is able to compare their result to those achieved by the other laboratories. The effect of the different solvent extraction efficiencies can therefore be investigated through a study of the proficiency scheme data (however, the effect of sample preparation cannot be investigated as the same spiked, homogenised reference material is supplied to each laboratory).
The solvent and analytical methods are detailed in the CONTEST data, and from Round CN118 it is apparent that there is no clear trend between the solvent used and the results for the three to five ring PAHs. However, for naphthalene, although there is notable variation between laboratories, those using DCM have generally measured a greater concentration (averaging at 1.08mg/kg) when compared to those using hexane/acetone (averaging at 0.78mg/kg).
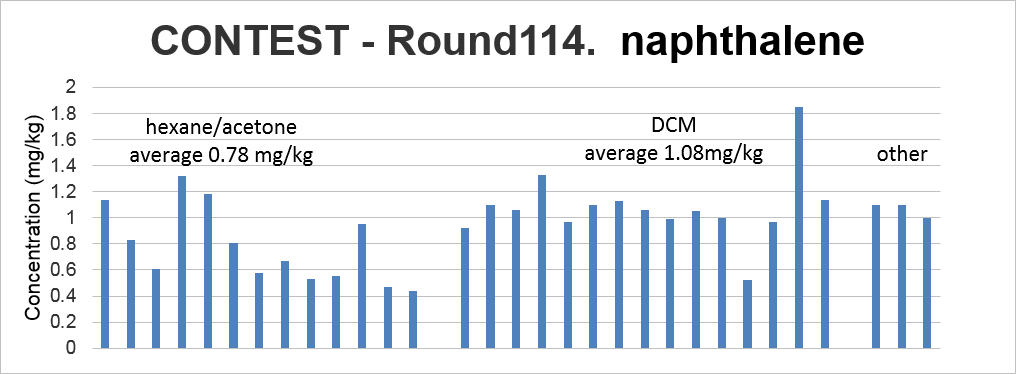
This suggests that for naphthalene at least, the solvent used by the laboratory does affect the concentration that is reported, with laboratories using hexane/acetone being likely to report a lower naphthalene concentration than those using DCM. When combined with the uncertainty regarding the potential loss of naphthalene during drying, it is questioned whether the adoption of a very low threshold value for naphthalene is reasonable.
Conclusion
The potential effect of the variation in sample preparation methods between laboratories remains significant, and whilst no one method is ‘the correct method’, engineers and consultants who are scheduling analyses should be aware of how the laboratory will prepare the sample and what effect that could have upon the results and how they interpret them.
All too often, when a sample that is known to contain fragments of clinker, slag or part burnt coal is found to contain a metal or PAH concentration in excess of a human heath threshold value, the default position is to recommend removal or a capping scheme. If, however, the results were considered with knowledge of the sample preparation method, a more appropriate analysis could be carried out on a sieved sample that may yield a result that could indicate that remedial measures were, in fact, not necessary. Such sieved re-testing of samples is not significantly costly or time-consuming, and by gaining a greater understanding of the sample preparation method and the uncertainty associated with the analytical result, a far more sustainable remedial scheme can be considered. Similarly, before applying low threshold values, the potential variability between laboratories and the magnitude of the uncertainty associated with the analytical method should be considered.
Article provided by Mike Plimmer, Technical Director at Geotechnical & Environmental Associates