Abstract
The correlation between the water content of filter-paper disks and the porewater suction in soil samples is used to determine soil suction, and various equations have been proposed to model it. To verify whether the equations in BRE IP 4/93 for determining soil suction based on the water content of Whatman Grade 42 filter paper remain valid and can be used with currently available batches of Whatman Grade 42 filter paper, SSL and i2 Analytical laboratories confirmed experimentally that NaCl solutions can be used to calibrate Whatman Grade 42 filter-paper disks and the equations in BRE IP4/93 remain valid. The method is inexpensive and reliable. Filter paper from different manufacturers or other than NaCl solutions also can be used after calibration.
Introduction
Soil suction is the result of the interaction between soil, water and air, and is important in understanding the strength and behaviour of soils, in general, and unsaturated soils in particular. There are numerous direct and indirect methods for measuring soil suction in situ and in the laboratory (e.g. Ridley 2015; Esmaili and Hatami 2017). The filter-paper technique is the most commonly used indirect method for estimating soil suction because of its low cost, simplicity, and wide range of suction values (0-5 MPa). The method evolved in Europe in the 1910s and USA in the 1930s (e.g. Frendlund et al 2012; Fondjo et al 2020).
Soil and filter paper (direct contact), or porewater vapour and filter paper (indirect contact), are equilibrated for several days in an airtight container. Subsequently, the water content of the filter paper is determined, and the soil suction is calculated by using equations that relate the filter paper water content and soil suction (e.g. BRE IP 4/93; ASTM D5298).
The total suction ψ in soil is the sum of the matric suction (ua – uw) and osmotic suction π determined by the direct and indirect contact of soil and filter paper, respectively,
ψ = (ua – uw) + π,
where ua is the pore-air pressure and uw is the porewater pressure.
The calibration of filter paper involves either equilibration of filter paper in a suction or pressure plate at different applied pressures or by non-contact equilibration of filter paper over salt solutions, e.g. NaCl, KCl, Na2SO4, or MgCl2, with different salt content, and then independently determining the filter paper water content (WCFP). The data from various calibration studies suggest that for suctions greater than ca 1000 kPa the total and matric suction calibration curves converge but diverge at lower than 1000 kPa (e.g. Fredlund et al 2012).
Whatman Grade 42 or Schleicher & Schuell No. 589-WH filter papers have been used in soil suction tests, and many studies have established and evaluated calibration equations. Even though filter paper is an industrial product manufactured under strict control, it is not clear if the manufacturing process and thus quality of the filter papers remains the same over the years or if the published calibration curves are applicable to the currently available filter paper batches. Thus, calibration of each batch of filter paper is recommended (Marinho and Oliveira 2005).
This paper describes the calibration study undertaken by SSL & i2 Analytical to demonstrate for accreditation purposes that filter papers can be inexpensively calibrated by using salt solutions, and the equations in BRE IP 4/93 (Crilly and Chandler 1993) can be used with currently available Whatman Grade 42 filter paper batches.
Method
Equipment
- Ash-free Whatman Grade 42 filter paper (CAT No. 1442-070 & Lot No. 16971096) 70 mm in diameter
- Thermometer (±1 ⁰C accuracy)
- Laboratory balance with an accuracy of 0.1% of the weighed mass
- Oven capable of maintaining the temperature at 105 ± 2.5 °C
- One pair of metal tweezers
- 200 ml terrine jars, with mouth size of 100 mm to allow for the filter papers to be placed inside without touching the jars
- Corrosion-resistant metal or plastic pipe to act as a support for the filter paper disks
- Glass beads to secure the supports
- Six aluminium circular tins
- A large glass flask with distilled or de-ionised water
- Desiccator
- Cooler box
Method
Salt solutions were prepared by dissolving table salt in distilled water (Table 1). All equipment but the thermometer and filter papers were thoroughly cleaned by carefully washing and rinsing them with distilled water, and then dried. Latex gloves and tweezers were used to prevent the transfer of any oils or other contaminants and handle the filter-paper disks. The filter-paper disks were dried and kept at 105 ± 5 ⁰C.
Clean glass shards or beads were placed at the base of the jar to support the plastic or metallic pipe upon which the filter paper disks were placed. Prior to placing the filter-paper disks, the glass jars were filled with the salt solutions.
Two filter papers were placed above the salt solution on the supports so they had 2 cm clearance from the surface of the solution and protruded more than 1 cm past the support in all directions but were not in contact with the jar. The jar contents were then secured with a water tight lid. The configuration is shown in Fig. 1.
A set of six jars was placed within a cooler in a temperature-controlled laboratory room (23 ± 2 ⁰C) and left undisturbed for two weeks to equilibrate. Room temperature was maintained at 23 ± 2 ⁰C.
After equilibrating for two weeks, the jars were removed and the filter papers were placed into aluminium tins for initial weighing; this part was performed by two technicians who worked on each jar together to reduce the amount of time that the filter papers were exposed. The aluminium tins were then placed in a dry oven set at 105 ± 2.5 °C for a minimum of 16 hours with the lids half-off to dry completely. The following day the lids were replaced and the aluminium tins containing the filter papers were left to equilibrate in the oven for 5 min before being removed and allowed to cool in a desiccator. After this second dry weighing, the water content was calculated.
Discussion
The data from the calibration tests at the SSL Bristol and i2 Analytical laboratories are given in Table 1. The 0% NaCl solution was deionised water. The filter-paper water content data suggest good reproducibility and repeatability between and within laboratories, respectively. The suction values at 23 ⁰C were calculated using the online molality calculator of omnicalculator.com.
The osmotic suction π values in Table 1 are compared with the values generated by using the equations in 1) BRE IP4/93 for matric suction and 2) Leong et al. (2002) for total and matric suction (Fig. 2):
1a) log kPa = 4.84 – 0.0622 × WCFP 15% ≤ WCFP ≤ 47%
1b) log kPa = 6.05 – 2.48 × WCFP WCFP > 47%
2a) log kPa = 8.778 − 0.222 × WCFP WCFP < 26%
2b) log kPa = 5.31 − 0.0879 × WCFP WCFP ≥ 26%
The data in Fig. 2 suggest that the non-contact calibration data represent total suction values and agree with the convergence of matric and total suction values at approximately 1000 kPa (log kPa = 3) and at about 25% WCFP.
At filter-paper water content greater than 25% the calibration data well agree with the Leong et al. 2002 equation for total suction, suggesting that the Whatman Grade 42 filter paper produces data consistent with published calibration equations.
The equations in BRE IP 4/93 and Leong et al. 2002 for matric suction are in good agreement, which suggests that the equations in BRE IP 4/93 can be used to calculate soil suction, with currently available batches of Whatman Grade 42 filter paper.
There are no calibration data for matric suction; however, considering the agreement between the test data and equations 1a and 2b above, it is reasonable to argue that the currently available calibration equations, including the ones in BRE IP4/93, can be trusted to return reliable suction values.
Conclusions.
NaCl solutions can be used to calibrate ash-free Whatman Grade 42 filter paper. The calibration method is simple and non-expensive. Furthermore, the results strongly suggest that the equations in BRE IP 4/93 can be used to determine soil suction in the laboratory, with currently available batches of Whatman Grade 42 filter paper.
Acknowledgements
Tabetha Hellard, Elizabeth Hort and Kellon Booker at SSL and Dariusz Piotrowski, Ewa Plona, and Aleksandra Jurochnik at i2 Analytical kindly agreed to perform the calibration tests.
References
ASTM D5298-16 (2016) Standard test method for measurement of soil potential (suction) using filter paper, ASTM International, West Conshohocken, PA, 2003, DOI: 10.1520/C0033-03, www.astm.org.
Crilly, M.S. and Chandler, R.J. (1993) A method for determining the state of desiccation in clay soils, BRE information paper, IP4/93. HIS BRE Press, Bracknell, UK.
Esmaili, D. and Hatami K. (2017) Comparative Study of Measured Suction in fine-grained soil using different in situ and laboratory techniques, International Journal of Geosynthetics and Ground Engineering, 3:27
Fondjo, A.A., Theron, E., and Ray. R.P. (2020) Assessment of various methods to measure the soil suction, IJITEE, Vol. 9, Issue 12, pp. 2278–3075 (online).
Fredlund, D.G., Rahardjo, H., Fredlund, M.D. (2012) Unsaturated soil mechanics in engineering practice, pp 939, John Wiley & Sons, Inc., Hoboken, New Jersey.
Leong, E. C., He, L., and Rahardjo, H., (2002) Factors Affecting the Filter Paper Method for Total and Matric Suction Measurements, Geotechnical Testing Journal, Vol. 25, No. 3, pp. 321–332.
Marinho, F.A.M. and Oliveira, O.M. 2005. The filter paper method revisited, Geotechnical Testing Journal, Vol. 29, No. 3, pp. 1–9.
Ridley, A.M. (2015) Soil suction — what it is and how to successfully measure it, Proceedings of the Ninth Symposium on Field Measurements in Geomechanics, Australian Centre for Geomechanics, Perth, pp. 27-46.
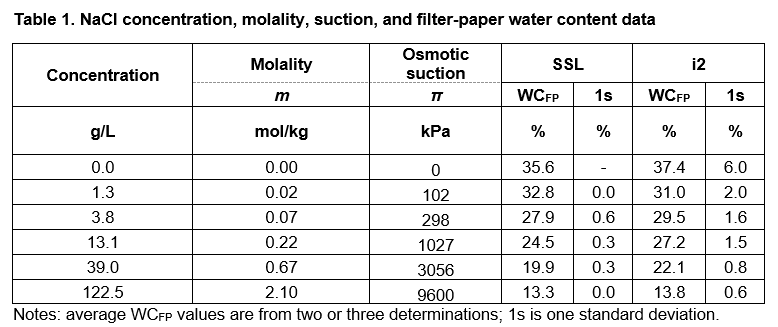
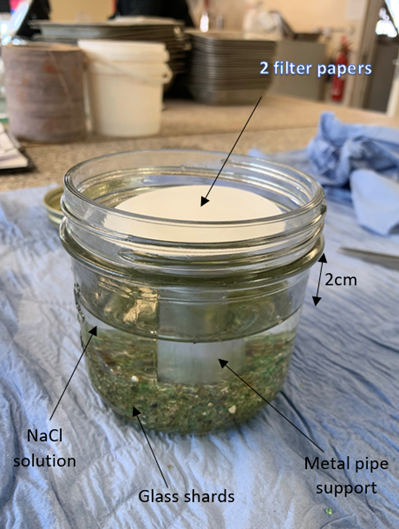
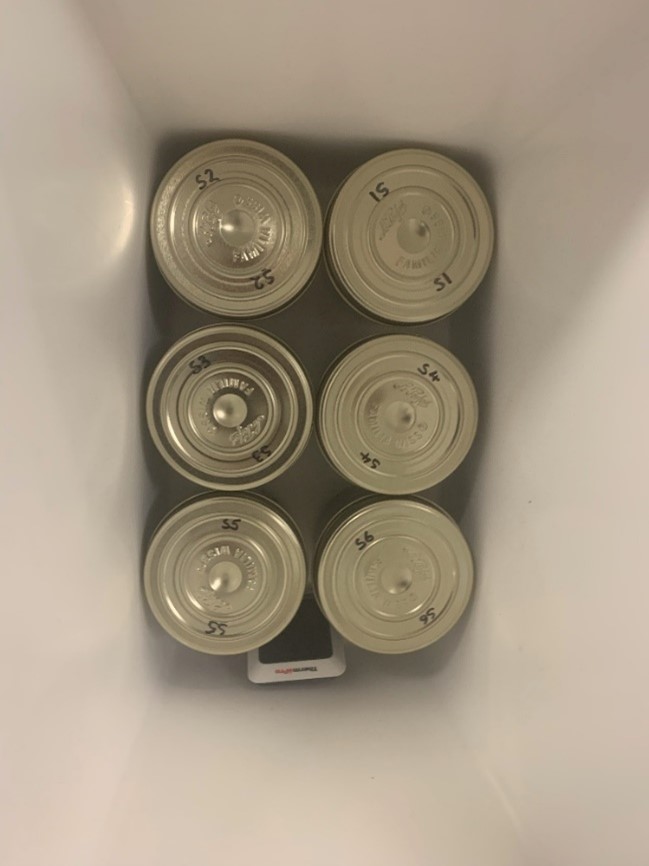
Fig. 1. Test configuration for (a) a single jar (left) and (b) six jars during the two-week equilibration period (right).
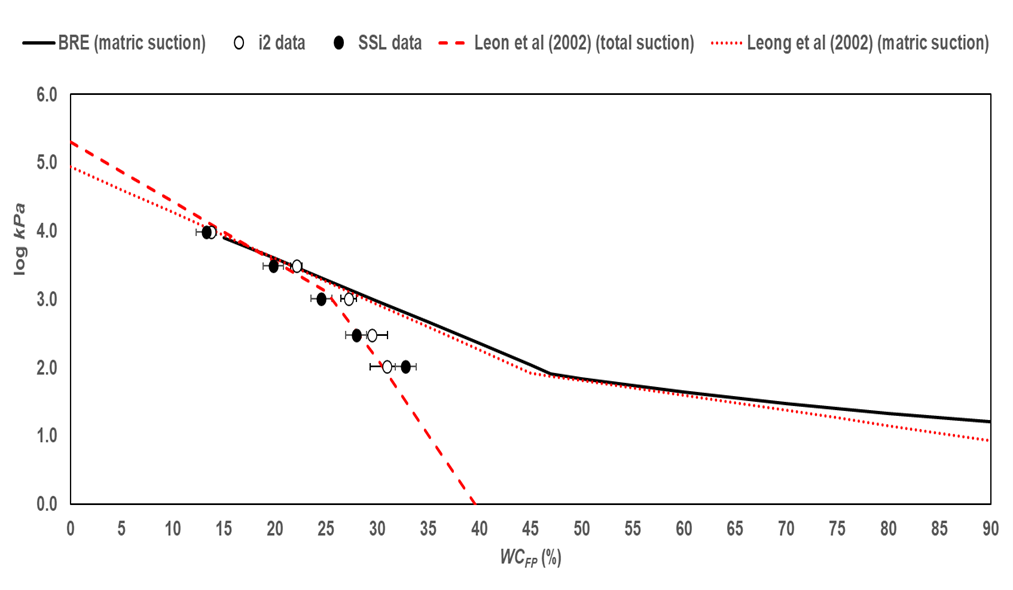
Fig. 2. Filter-paper calibration test data compared to published calibration equations.
Article provided by Dimitris Xirouchakis, Director at Structural Soils Ltd