Within the wider construction industry, the geotechnical & geoenvironmental industry has been criticised, sometimes for good reason, for a poor safety record. It is true that this industry has not had the level of investment that mainline construction enjoys and there is internal, and client led pressure to deliver cost effective practices that can sometimes slow safety improvement and at worst negatively impact it.
To quantify the safety performance of the geotechnical & geoenvironmental industry and provide a benchmark from which to measure improvement, the Association of Geotechnical and Geoenvironmental Specialists (AGS) requested all members to volunteer accident data for the past two years as part of the annual members survey. From the members, an above statistical threshold (twenty-one) of twenty-seven organisations provided data.
How do the two industries compare?
Applying Health and Safety Executive (HSE) frequency and incident rate formulas to allow benchmarking against the HSE published Construction Statistics in Great Britain 2022, a direct industry comparison can be made.
From the HSE data, a construction workforce headcount of 2,048,611 can be identified, and a 2022 construction industry Accident Incident Rate (AIR) of 239.28, (35 fatalities + 4,185 non-fatal accidents / workforce) x 100,000 = 239.28.
In comparison the geotechnical & geoenvironmental industry (from the data provided) has an AIR of 31.28 in 2022 and 81.63 in 2021. On face value, an AIR seven times lower than the construction industry could be celebrated, however the wider picture needs to be examined before the bunting comes out.
While some activities within the geotechnical & geoenvironmental industry are high risk, such as the person plant interface during drilling activities and underground utilities, the exposure to many additional high-risk construction hazards are limited, such as working from height, confined spaces, lifting activities, etc. Therefore, a like for like comparison with construction provides little value, as the risk profiles differ vastly. Yes, drilling is a hazardous operation, but it is only one element of the geotechnical & geoenvironmental industry, and yes, the construction industry does consist of many low risk tasks, but these are surrounded by other high risk activities.
What can the data tell us?
The real value within the data can be seen when we start to look at how different size organisations compare to each other and by setting a benchmark for subsequent years incident data to be measured against.
Before looking at the incident data by organisation size, it can be assumed that small organisations have less incident reporting processes than larger organisations, as it is not needed, organisational leaders have line of sight of the incidents and can document them. Likewise, it is less likely for a small organisation to formally record hazardous events, as they are seen first-hand, and these is a much smaller group to share information with, word of mouth is sufficient.
Likewise larger organisations have tried and tested systems, with dedicated safety professionals, supported by supervisors and managers to ensure that all incidents are reported, and hazardous events recorded, with learning shared across the workforce.
The organisations which can sometimes be weaker in incident reporting, incident management and incident learning are the medium size organisations. This is dependent on the time they have been operating in this space and particularly affects small organisations which have experienced rapid growth, with little time to implement improvements in their incident management and learning.
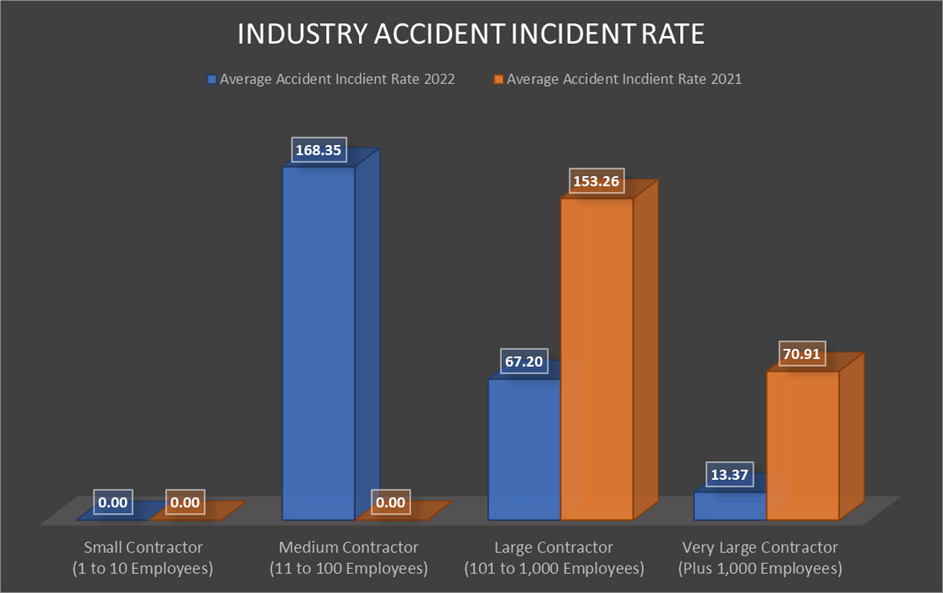
Within organisations with smaller headcounts a single RIDDOR reportable accident can have a significant impact on their AIR. As an example, organisations within the medium contractor group, with a combined head count of 594 has recorded one accident, resulted in an AIR in 2022 of 168.35. Compare this with a single accident recorded by large organisations in the same year produces an AIR of 67.29. To produce benchmarkable AIR targets an average is required across a longer sample period, as our group size is relatively small.
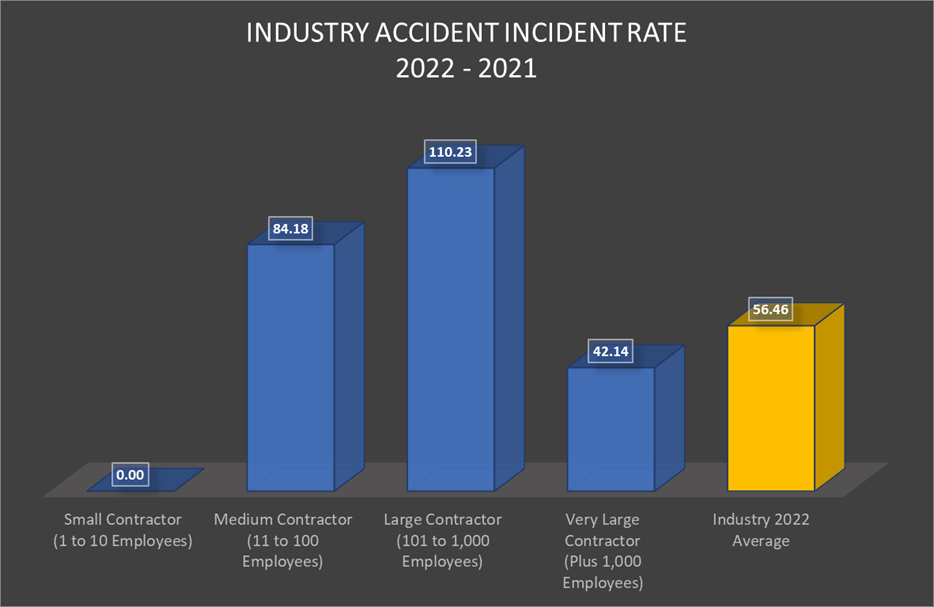
The above chart details the average AIR across two years for each organisation size, which is a better demonstration of the performance of the different size organisations, together with an overall industry average. This allows comparison against similar organisational performance and future safety improvement within the industry as a whole.
When examining the small and medium contractor accident data, 39% of organisations did not record any accident, near misses or hazard events over the two-year period, highlighting a poor reporting culture and indicating a potential higher AIR than 0.00 for small and an increased rate for the medium contractors than is shown.
The Accident Frequency Rate ((AFR) total injuries / hours worked x 1,000,000)) provides a better indication of overall safety performance, as the rate is inclusive of minor injuries as well as RIDDOR reportable, which can sometimes be under reported.
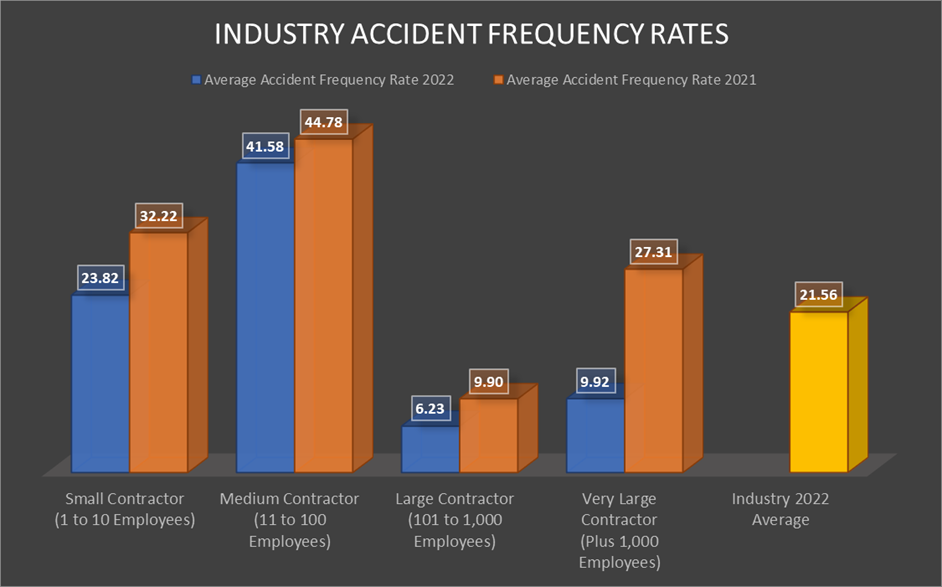
Like the AIR, with 39% of small and medium contractors recording no accident data, the AFR for small and medium sized contractors could be significantly higher than detailed. This is a clear area of improvement for the industry, both in improving accident reporting and record keeping by the small and medium sized organisations and targeting these small sized organisations to develop safer working practices which will reduce harm.
The AFR across all organisations remains relatively close within 2022, ranging from 6.23 to 41.58 and an overall geotechnical & geoenvironmental industry AFR of 21.56. This provides a useful benchmark for the industry and individual organisations to measure their performance against.
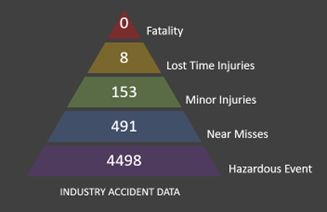
Going further, to look at industry accident and incident reporting culture, the data needs to be compared with a suitable reporting frequency model. The original “accident pyramid” published by Herbert Heinrich in 1931 found that in a grouping of 330 similar accidents, one will result in serious injury (fatality, disability, lost time, medical treatment), 29 will result in minor injury (first aid), and 300 will result in no injury. Comparing industry data to an accident frequency model like this provides awareness of industry culture, as the model has been tried and tested, it is relevant. But is there a better model to use?
Looking at more recent studies there are two which go further. In 1969, Frank E. Bird conducted a follow-up study using a larger, more-randomized sample size (1,753,498 accidents). Bird found a ratio of one serious injury for every 10 minor injuries, 30 property-damage accidents, and 600 near-miss safety incidents. Due to the rigor of the study, this 1-10-30-600 ratio was accepted as an archetypal ratio in occupational health and safety.
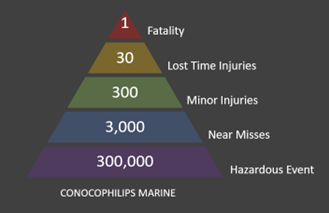
The most recent major study of the safety ratio was undertaken by ConocoPhilips Marine in 2003. It placed the Safety Triangle within a modern occupational context and found that for every single fatality there are at least 30 lost workday cases, 300 minor injuries, 3,000 near misses (estimated), and 300,000 behaviours not consistent with proper safety procedures (estimated). Aligned to the advancements in safety delivery from 1969 up to 2003, this model is more suited to today’s standards.
From this comparison several statistical features can be observed.
Firstly, looking at the relationship between lost time injuries and fatalities it can be suggested that every 7.5 years a person working in the industry will lose their life to a workplace accident. Although not measurable over a single time period, over 37.5 years the average of 1 fatality every 7.5 years would be correct, providing there is no changes to the current working practices, and no course change between now and 2060.
The relationship between minor accident and lost time accident reporting rates statistically holds up to the ConocoPhilips Marine triangle. As these are harm accidents, it is common for these to be the most robustly reported, as following first aid administration, the first aider has a duty to report.
Looking down the triangle from minor injuries, there are clear industry weaknesses within near miss and hazard reporting. The current industry near miss reporting rate is showing an under-reporting value of 39%, highlighting a need for improvement.
Focusing on hazard reporting, 57% of the contractors stated that as an organisation they did not record hazard events and this shows, although not to a sufficient level to bring the hazard report rate in line with our accident triangle model. If the 57% reported hazardous events and at risk behaviours at the same rate as those in the industry that do, a total value of 11,924 reports would be made against a target rate of 80,000. Ignoring such an uplift, the industry hazardous event reporting rate is at a dismal 5.6% against the statistical target.
Both near miss and hazard reporting are proactive tool which can be used to prevent accidents from occurring. An improvement across both near miss and hazardous event reporting, learning and communication of the learning, would significantly reduce the amount of people harmed because of working within the geotechnical & geoenvironmental industry.
While we can not benchmark our industry accident data against the construction industry effectively, what we can do is learn from those that have walked the well-trodden path before us, in this case the drive within the construction industry to promote the importance of near miss and hazardous event learning to prevent harm.
If the organisations within our industry invest in putting in systems to capture, learn from and communicate our near miss and hazardous event learning, as an industry we can drive down the industry accident rates and improve prevention. Ultimately, we can delay, with the desire to prevent, the once in a seven and half year fatality to our workforces, colleagues, and friends.
Author Note: The sharing of accident data by AGS members has allowed the collective data to be examined to identify what, as an industry, we should be focusing on to reduce harm to our members. Please continue to share this information as it is requested each year, so we track the progress of our industry and focus our efforts within the areas which will have the most impact.
Article provided by Jon Rayner, AGS Safety Working Group Leader