Since the introduction of Eurocodes and the classification of samples with respect to disturbance, there has been much debate in the investigation industry as to the use of our traditional cable percussion sampling and in-situ testing techniques. Whilst we at Soil Consultants are full advocates of improvements and increased quality there is, to our mind, still a relatively big unknown with regards to the benefits of high end in-situ testing techniques and/or rotary coring over the use of traditional cable percussion drilling methods. This brief article is designed to stir some thought amongst the industry in comparing the use of ‘traditional methods’ over the more ‘improved’ sampling and testing techniques called for in EC7 and not to undo the good work put into improving quality within the industry.
Over the last few years, and major infrastructure projects aside, it is still apparent that the majority of engineering practices who specify ground investigation have little knowledge of Eurocode in relation to ground investigation, in what they are specifying, the methods available to achieve the geotechnical objectives and the scale of costs involved. Thus, ground investigation is still all too commonly awarded on a combination of lowest cost and ignorance, which the specifiers [and by default the client] are willing to accept as ‘value for money’. The Eurocodes are attempting to bridge this divide, but is the complexity and lack of understanding of these documents still preventing the advancement of quality and achievement of value? From feedback in the industry [largely structural engineering practices], there appears to still be much work to do with regards to quality of investigation, quality of service and the value of ground investigation which only we as an industry can control and one which is constantly debated!
Since the publication of EC7 and its requirement for valid laboratory strength and deformation testing to only be performed on ‘Class 1’ samples, the use of the traditional U100 has been somewhat dismissed by the codes and consequently a stronger reliance has been put on SPT testing as a compliant technique along with ‘our knowledge of the geological formations’. The use of the SPT has most likely been driven by our industry seeing this as a far less expensive alternative to rotary coring and a more practical method for congested and restricted access sites. Indeed, this would be true as, in our experience, rotary coring averages about 200% more expensive than cable percussion drilling and few inner city sites offer the necessary access and working areas. Pressuremeter testing also comes with a hefty price tag with an individual test averaging about £2,500 on a typical project. The question which arises from this is: ‘Does the quality of sampling and specialist in‑situ testing provide the accuracy and reliability to justify their use and the expense?’. The reality of this expenditure needs to be fully justified to provide confidence to the client and the design team that the results are more accurate and representative thus providing more valued engineering. The counter argument to this being, ‘Is it better to obtain a greater data set, from say cable percussion techniques, to provide a more reliable average, which could be achieved through a higher number of boreholes and tests at significantly less expense?’
With traditional techniques, the introduction of the UT100 [thin walled sampler] has bridged the gap somewhat in the sample disturbance argument and has been rudimentarily accepted. However, this sampling technique still does not fully comply with the requirements of EC7 due to the percussive driving of the sampling tube and it has important limitations in its practical use. Energy efficiency measurements for SPT hammers has also been made part of the Eurocode requirement, but this still comes with problems as there is a demonstrable divide in consistency of the testing techniques and the measured energy efficiency, as the table below shows. Arguably, and hopefully reassuringly, the majority of hammers seem to improve with age which could indicate that operators are looking after and properly maintaining their equipment. However, erratic results are not defined by the Codes and this raises the question as to whether or not there should be some benchmarking to condemn poor performing equipment.
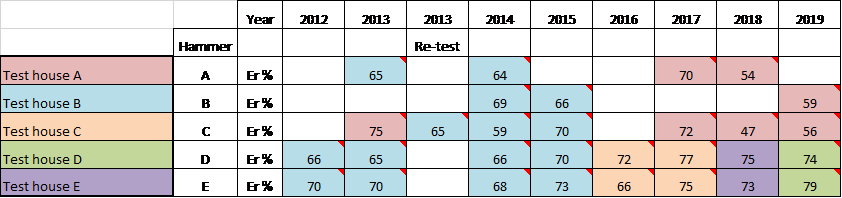
Table 1: Different cable percussion hammer ratio records since 2012; colour coding represents the calibration test house.
In order to put the questions above into context, Soil Consultants have put together a data set of testing of the London Clay from our projects undertaken within central London using various sampling and testing techniques. The data represent the ‘more traditional’ techniques adopted through cable percussion drilling as well as rotary coring and Pressuremeter testing. In-situ CPT has not been included as we do not have access to a relevant data set at this time. It is recognised that there are limited data available for pressuremeter testing and some of these data have been obtained from public open sources, but still relevant to the geology and geographical location.
Clearly, there are numerous arguments for and against the various techniques with regards to disturbance and testing orientation but it is acknowledged that there are flaws with all methods and the data have been presented on face value from ‘real’ projects. In this data set, we have considered:
- Cu derived from ‘metal’ UT100 and steel U100 sampling tubes – we are unable to segregate between thin wall and thick wall tubes although the majority of samples shallower than 15m have been obtained using UT100s
- Cu derived from plastic U100 tubes
- Cu derived from rotary core samples
- SPTs, both uncorrected and corrected for N60 [Cu plotted as 5*N] and
- Pressuremeter testing
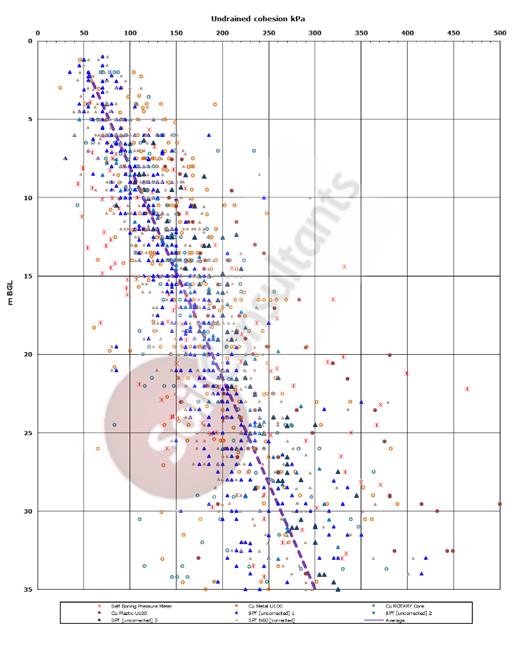
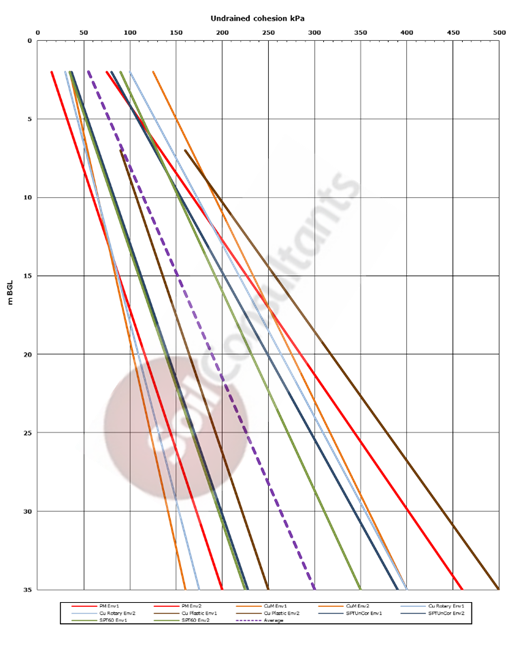
Graph 1 shows the culmination of nearly 1,200 data points and whilst the number of points make the graph difficult to read, Graph 2 presents the envelopes of each of the data sets [lower and upper bound limits representing approximately 90% -95% of the data points ignoring anomalous low and high values]. On these graphs is also plotted ‘an average line’ which has been derived through simple visual assessment of the data set [based on the lines produced by four engineers assessing the data independently]. Whilst this is not technically a scientific average, we believe this is representative of ‘the designer’s’ approach.
Graph 1: All data points
Graph 2: Envelopes to individuals data sets
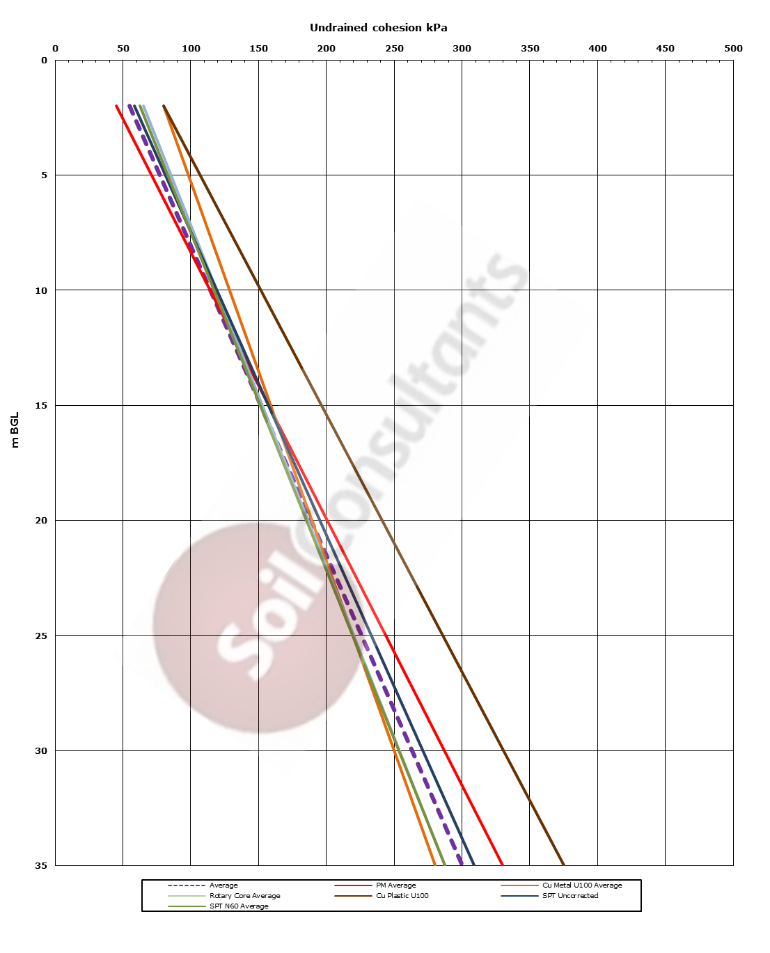
Graph 3 further simplifies the data by plotting the middle average of the envelopes and also includes the ‘average’ line from all data as a visual benchmark which, is continued through all graphs. Graph 4 compares these data sets with the shear strength profiles for London Clay presented by Patel [1992] on 100mm diameter specimens.
Graph 3: Average profiles
Graph 4: Average profile and Patel’s envelope
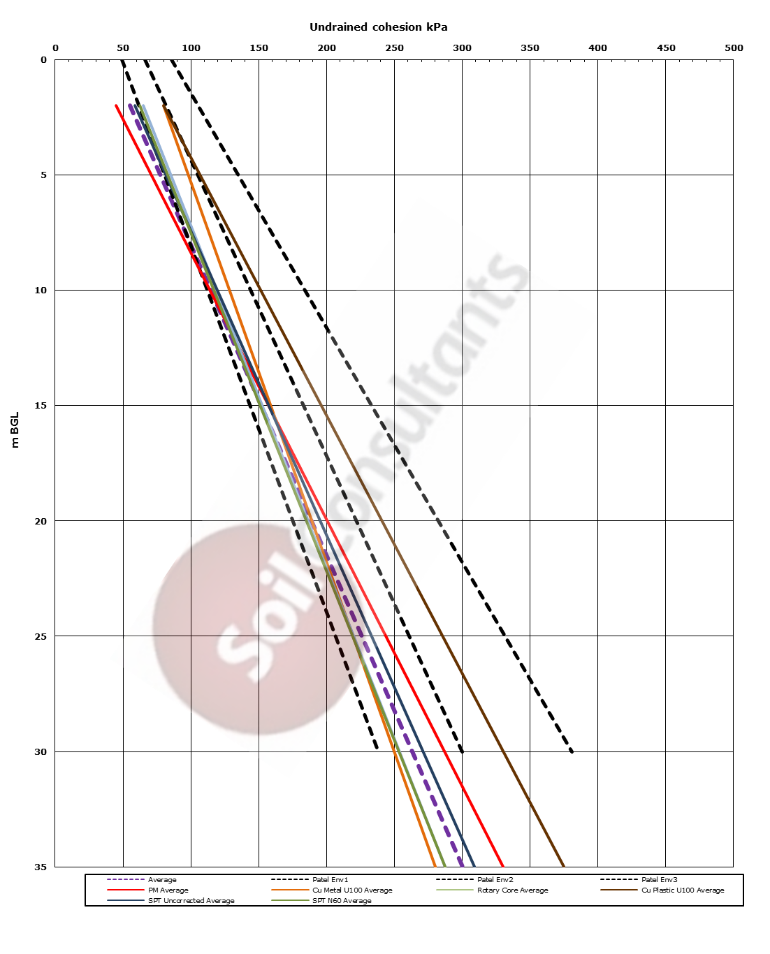
Although this is not an exhaustive analysis, on face value, the following points are noted:
- The Pressuremeter testing and Cu derived from rotary core show the widest scatter of data. Cu measured from samples obtained in metal sampler tubes also exhibits a wide scatter
- Uncorrected SPT-derived Cu shows the narrowest envelope of all the data sets. Correcting the N value for energy efficiency, serves to further narrow this envelope
- Whilst samples derived in plastic U100 sampler tubes gave a similar scatter in results to other ‘undisturbed’ measurement techniques, the overall strengths measured were greater, giving a higher average
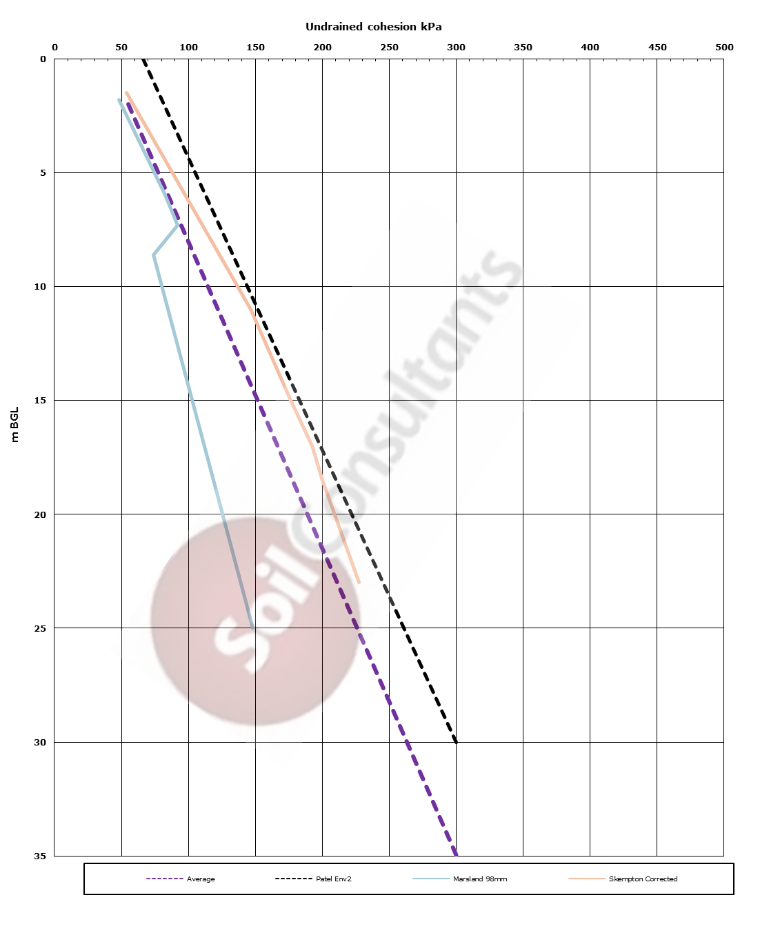
Graph 3 plots the average of the envelopes which surprisingly produces a relatively tight group of lines, slightly divergent at shallow depth, tightening together at about 15m before diverging with depth. Patel’s 1992 paper produced a set of data for the London Clay and shear strength measured from U100 samples [type of sampling tubes are not reported]. A refinement of Patel’s data has been undertaken with only the more central London sites being considered to provide a comparable data. The average and lower bound envelope of this refined data set are shown on Graph 4. The majority of the average data is seen to lie close to the lower bound line of Patel’s data, with only the measurements from plastic U100’s bucking the trend, with the results lying above the average line. By comparison, Cu depth profiles published by Patel;1992, Skempton;1951 [U38 values corrected for 77% strength CW publication 1991] and Marsland;1974 are plotted on Graph 5. Whilst there is a reasonable consistency with the gradients of the strength profiles, there is a significant divergence in measured Cu.
Graph 5: Cu profiles by various authors
So, what does this mean? At this stage, it is arguable that the traditional U100 and SPT techniques are valid and show a no worse scatter than more ‘refined’ techniques. That is not to say that any of the techniques do not have a place because this is very much ‘horses for courses’ and the overall geotechnical requirements of a particular project will dictate technique in certain circumstances. For more routine investigations, the use of the more traditional U100 and SPT techniques, providing a greater data set could, in our view, give better value for money and a justifiable confidence in obtaining characteristic design values. In saying this, quality of ‘workmanship’ is a considerable factor and investigation companies should ensure drilling operatives are suitably experienced and supervised along with ensuring equipment is well maintained and sampling tubes are clean.
The divergence of measured Cu profiles is proof that differences do exist in the London Clay and indeed, in our experience, the strength profiles around London do vary considerably, with some areas showing significantly weaker profiles than others; this should be accepted by the industry who should not be so quick to criticise the investigation contractor. Design engineers, in our experience, continue to try and oversimplify this formation but, the London Clay is a variable deposit and the ground is not ‘Just London Clay’ as we hear on so many occasions. Thus, investigation designers should be advocating a sensible level of investigation to provide a reliable and representative data set.
Whilst there is a wealth of information in the literature on the London Clay, on reflection, do we as an industry still need to put further research into sampling and testing techniques to provide the necessary confidence that routine ground investigation can provide reliable design parameters in light of the Eurocodes?
Article provided by Soil Consultants
Disclaimer: The contents of this article and the views represented within it are not necessarily reflective of the AGS as an organisation, or its Working Groups.
The AGS Geotechnical Working Group will be publishing a response to this article in a future issue of the AGS Magazine.